Updated Trinity Study for 2026- More Withdrawal Rates!
| Updated: |
(Disclosure: Some of the links below may be affiliate links)
Would you like to know precisely which withdrawal rate is safe and will sustain your lifestyle for a long time?
You will find the answer in this article, with updated results from the Trinity Study! This study researched different withdrawal rates for retirement. Although the original research was not about early retirement, it is often referred to in the Financial Independence and Retire Early (FIRE) movement!
However, there are two caveats to the original study. First, they are only covering the period until 1995. And then, they are not covering more than thirty years of retirement. Thirty years is not enough for some people wanting to retire early.
Therefore, I reproduce the original study’s results with recent data all the way to 2025! And I extended the data back to 1871. This makes for much more data than the original study.
I have also considered periods as long as 50 years. It means many more withdrawal simulations than the original study.
In this article, you will find how I did it and all the results I have gathered from this data!
The Trinity Study
I have already talked at great length about the Trinity Study. It is an excellent research paper done by three professors from Trinity University.
Their research paper’s goal was to see which withdrawal rates people should use to sustain a particular lifestyle for up to 30 years. It is important to note that the original research was not about early retirement but official retirement.
It is important to emphasize that we are talking about sustaining a lifestyle (expenses), not capital. So, if you end up with 1 USD at the end of the retirement period, this is a success. If you want to sustain your capital in retirement, it is a different success criterion not treated by the original Trinity study.
They tested the success rates of withdrawal rates from 3% to 12%. Furthermore, they tested portfolios with between 0% and 100% stocks by jumps of 25%.
The authors also took inflation into account in the results. Indeed, it is interesting to compare the results with and without inflation. Finally, they also provided the terminal values of the portfolio.
I wrote a detailed article about the Trinity Study if you want more information.
The 4% Rule (of Thumb)
The Trinity Study is the source of the 4% Rule. This rule states that if you only withdraw 4% of your initial portfolio yearly, you can sustain your lifestyle for a very long period. And your withdrawal is adjusted for inflation every year.
Some people believe that the original study shows that this will sustain forever. But this is not what the original research was about. They only tested simulations for up to 30 years.
It is better to call it the 4% Rule of Thumb. Because if you plan to retire very early, you will probably need a lower withdrawal rate. Moreover, your withdrawal rate will depend on your portfolio and asset allocation to stocks and bonds.
Why did I do it again?
If the study is excellent, why did I want to redo it? I have several reasons for that.
First, I wanted to see how this worked with recent stock market returns. The original study was only covering years up to 1995. I wanted to have more recent data. I wanted to ensure the results were holding with more recent stock market behavior. So this simulation will cover returns until the end of 2025!
Secondly, the original study only covered up to thirty years of retirement. I wanted to ensure that the portfolio could sustain withdrawals for extended periods. For people retiring early, I think that 50 years is not unreasonable.
Finally, I have to admit that I like to write code. So it was cool to write code related to this blog. And being a big geek, now I can run many simulations with the data I want. Overall, it was a lot of fun preparing the data for this article.
Ultimately, I want to extend the Trinity Study to the European markets. It will be challenging to obtain the data. But I will try to find it for as many years as possible.
How I redid the Trinity Study
My simulation uses monthly withdrawals. Most people in retirement will withdraw money monthly. It is also possible to withdraw money at the end of the year instead. But I believe that it is not common.
I have calculated all the returns monthly. Doing that makes the results much more accurate than doing it yearly. And the monthly withdrawal is updated with inflation every month as well. Every possible starting month in the available data is tested.
For this simulation, I have not done any rebalancing. For more information, I have compared different rebalancing methodologies for retirement.
Withdrawals are based on the current allocation. For instance, if your base allocation to stocks is 60%, but your current allocation is 80%, 80% of the withdrawal will be taken from stocks. If you are interested, I have explored other techniques in other articles:
Based on this simulation, I collected the same results as the original study: success rates without inflation, success rates with inflation, and terminal values.
Success rates of the Trinity Study
I start the simulation with the entire data from 1871 to 2025.
In this simulation, success is when your portfolio does not run out of money before the end of the simulation. For instance, if we simulate for 20 years and end up with one dollar after 20 years, it is a success. This is a failure if the portfolio runs out of money before that (it could be in the first year or the nineteenth year).
So, the success rate is the percentage of the months that end up with success. The higher the success rate, the better the results are.
We will see what success rates we have when we ignore inflation. We start with 20 years since I do not think anybody will care about a ten-year-long simulation. I will begin at a 3% withdrawal rate and go up to 12%, increasing by 1% at a time.
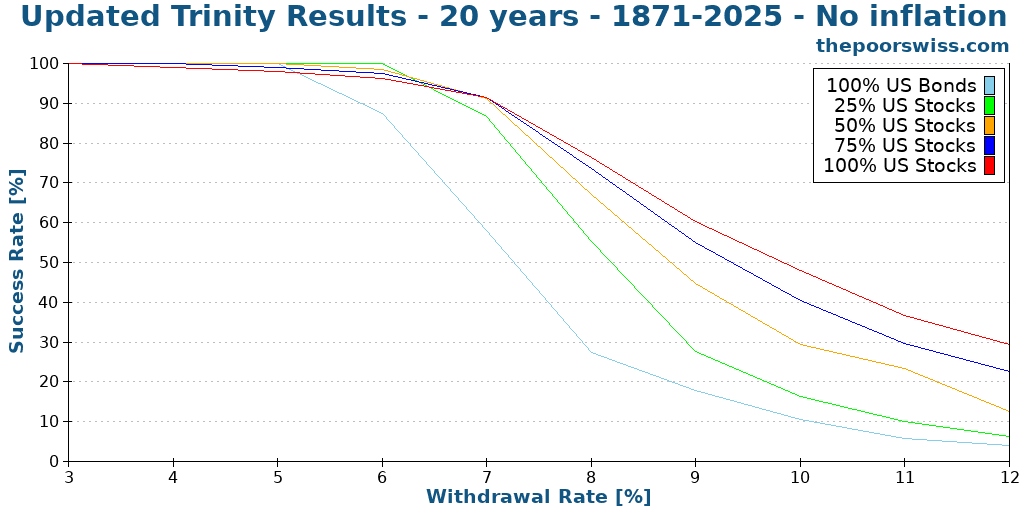
We can see what we already expect:
- Increasing the withdrawal rate decreases the chances of success
- Any withdrawal rate higher than 8% does not make sense long-term, even without inflation.
- A small allocation of bonds can help with lower withdrawal rates
- Generally, a 100% stock portfolio will perform better than the other portfolios.
Here is what happens when we push the simulation to 30 years.
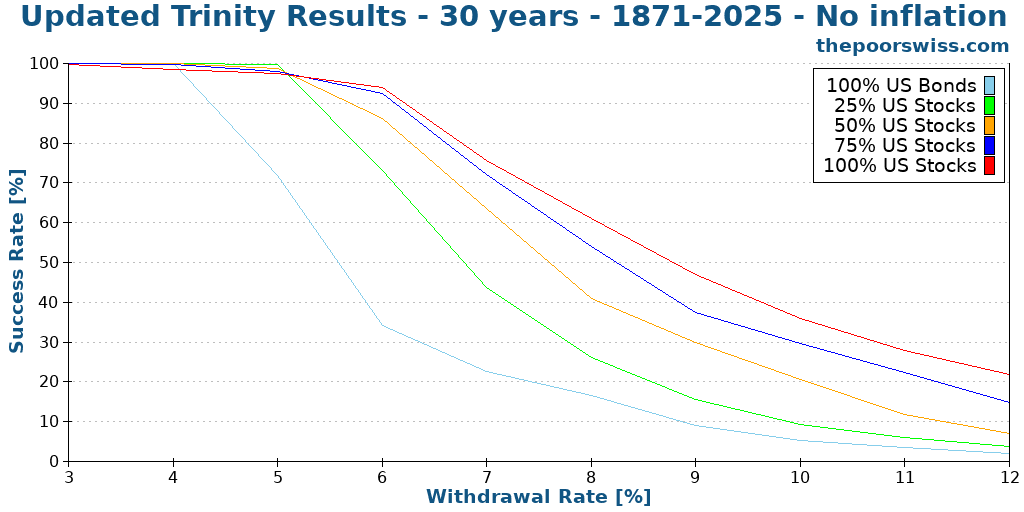
We can see that increasing the number of years decreases the likelihood of success. It is logical since you are more likely to run out of money.
With 30 years of retirement without inflation, a 6% withdrawal rate with a significant allocation to stocks still makes a lot of sense!
Taking inflation into account for retirement
However, it is much better to consider inflation in our simulation! We start again with 20 years to compare the results:
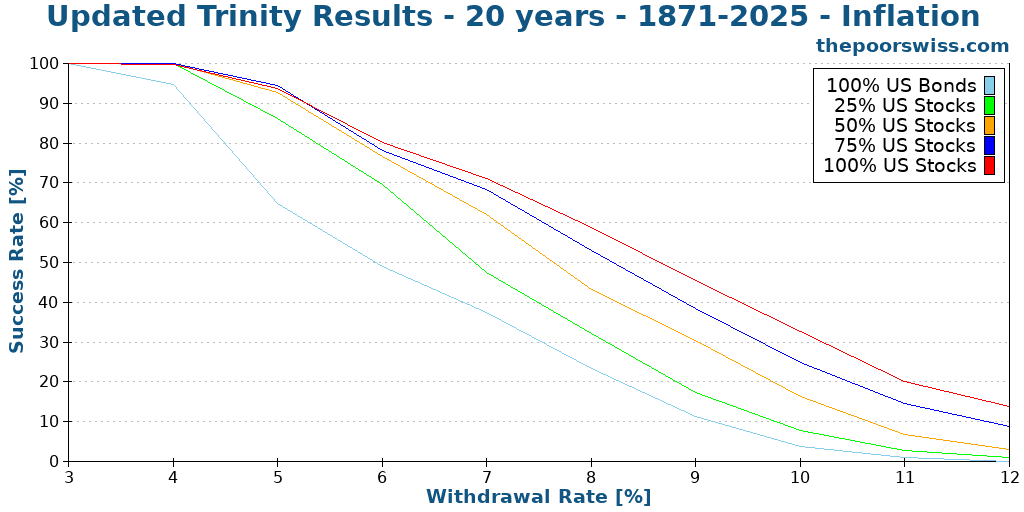
As we can see, inflation causes a significant hit to our chances of success! Before inflation, an 8% withdrawal rate made some sense. Now 6% is the limit. And even 6% has a barely over 75% chance of success!
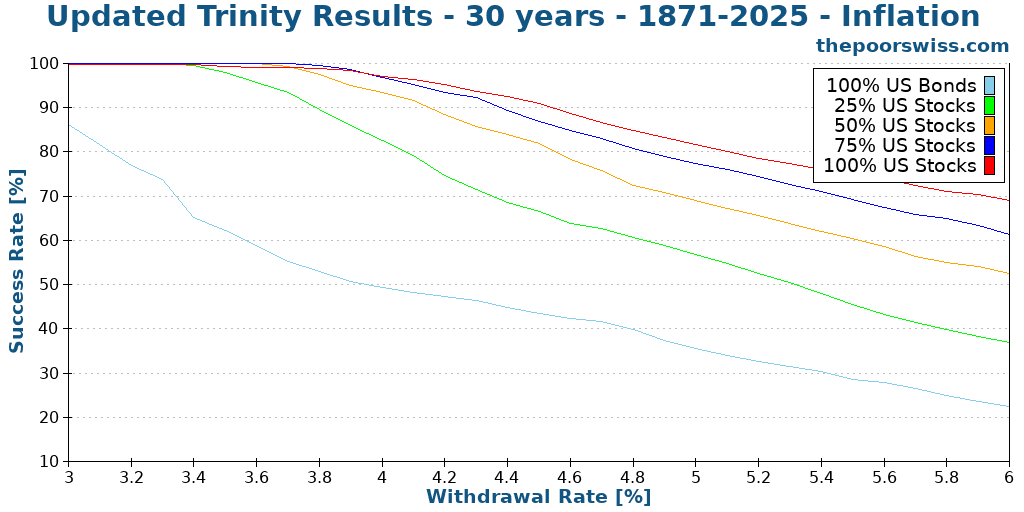
Here is what happens for 30 years of retirement.
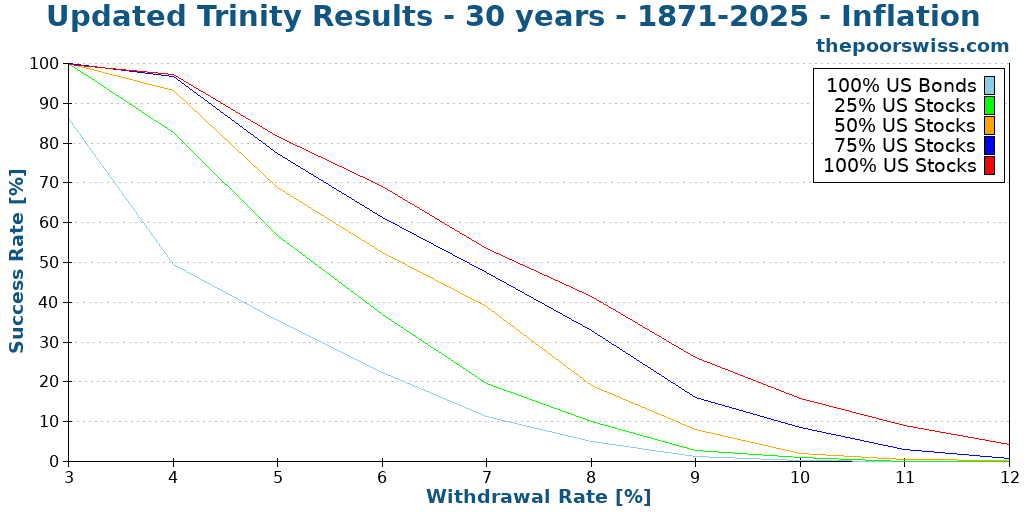
We can now see that anything higher than a 6% withdrawal rate is hazardous, with a less than 75% chance to succeed even with 100% stocks.
More withdrawal rates
Since we see that reasonable withdrawal rates are in the range of 3% to 6%, we try more withdrawal rates. I have simulated increments of 0.1% of withdrawal rates.
With a large stock allocation, withdrawal rates between 3% and 4% are very safe. Some people would even dare use withdrawal rates of about 4.5%. But even a portfolio with 100% stocks has only an 85% chance of success after 30 years with 4.5%.
Longer retirement time
One of the caveats of the original study is that they stopped at 30 years. We run the same simulation again but with 40 years this time.
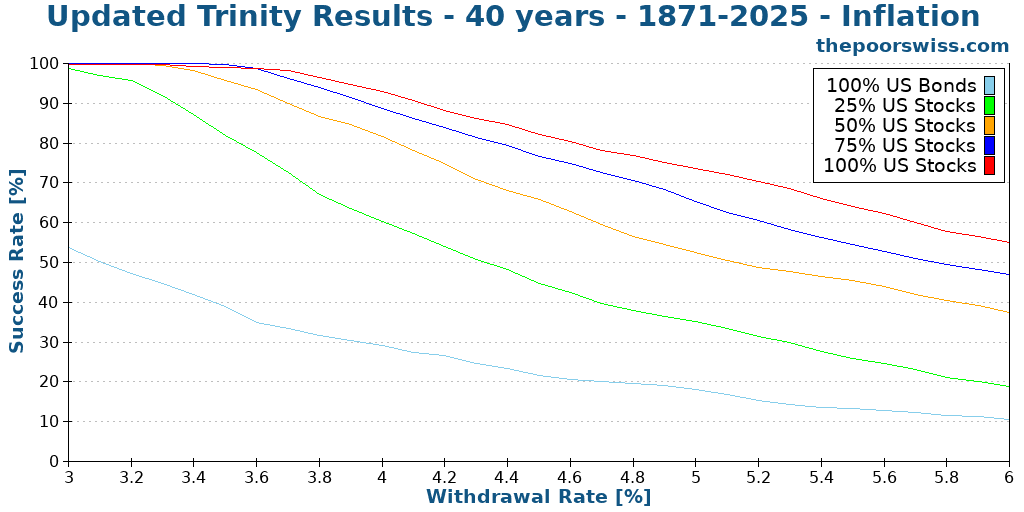
After 40 years, we are starting to see lower success rates, even for most people’s 4% withdrawal rate. Unless you have 100% of stocks, your success rate will be less than 90%.
Here is what happens in 50 years.
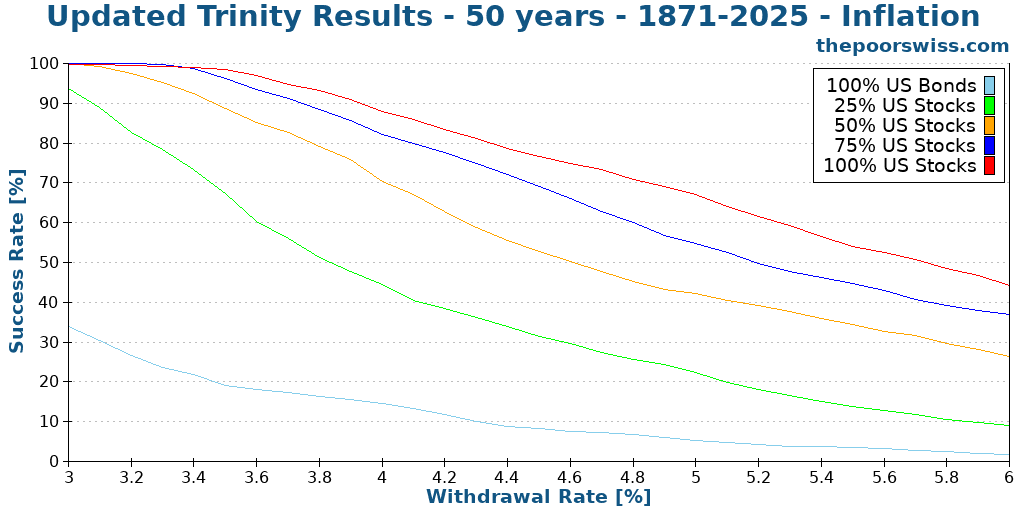
As expected, we see lower success rates. But it is still not bad at all with reasonable withdrawal rates. A 100% allocation to stocks and a 3.5% withdrawal rate still have more than a 98% success rate. This is significantly more than I expected.
It shows that the study’s original conclusion can still hold for over 30 years. It is excellent news!
Updated Terminal Values
Another interesting thing from the study was that they also compared the terminal values of the different withdrawal rates and portfolios.
So we will see the terminal values of a 1000 USD portfolio after 30 years. I did the simulation for a portfolio of 100% stocks. For the sake of display, I have reduced the number of withdrawal rates.
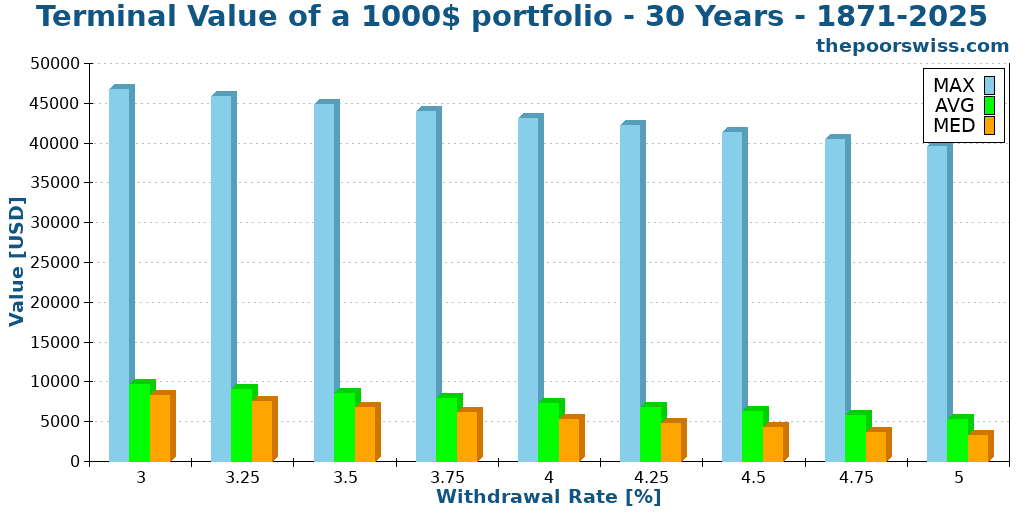
I did not show the minimum values. Indeed, they are always zero. If the chance of failure exceeds zero, the minimum value will be zero.
However, the average and median values are quite remarkable. We will focus on the median since it is generally more representative than the average.
For a withdrawal rate of 3.5%, my current target, the median terminal value after 30 years, is about 6700 dollars! Not only did your portfolio sustain your lifestyle, but it also increased sixfold! Let me repeat this. After 30 years of doing nothing but withdrawing money, you have six times more money than when you started!
The maximum values do not mean a lot. But it is crazy to see that after 30 years, you could have about 30 times more money than when you started! And this is with a 3.5% withdrawal rate!
Here is what happens when we extend it to 40 years.
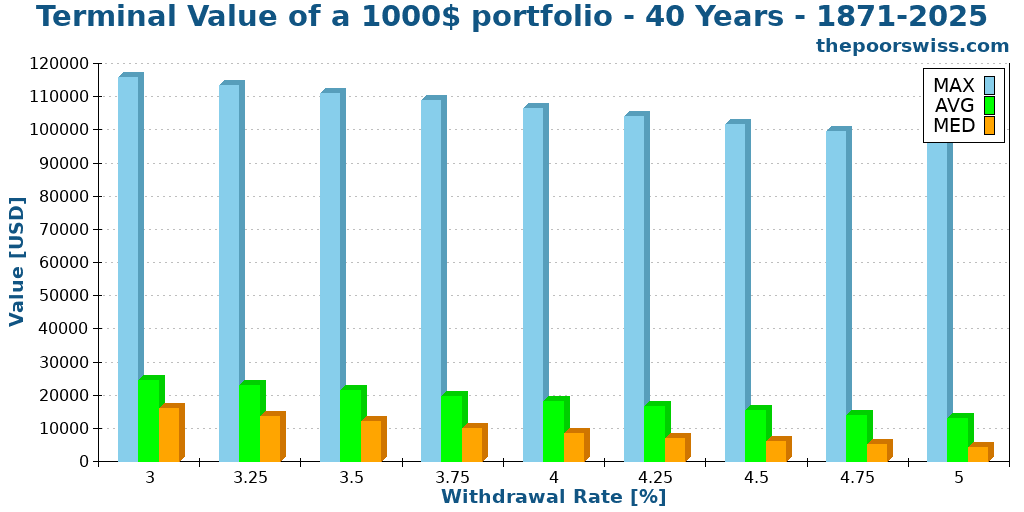
We can see that the results are comparable. However, all the values are significantly higher. The numbers are all about twice higher. On average, your retirement money will double during the ten additional years. So, even though you are not contributing more money and living from it, your portfolio will double in 10 years. How cool does that sound?
The success rate is not everything
There is something important with these measurements: the success rate does not tell the entire story. For instance, for you, which of these two scenarios is better?
- 98% to last 50 years, but a chance of running out after ten years
- 96% to last 50 years, but a chance of running out after 48 years
For me, the second scenario is better. You do not want to have a chance of failing after only ten years if you are planning for 50 years. But if it fails after 48 years, you have many years to make some adaptations.
So, another essential metric is the worst duration of a scenario. This means after how many months, the first failure can happen.
For reference, here are the success rates of each portfolio for 50 years and different withdrawal rates:

And now, here are the worst durations for each of these portfolios:
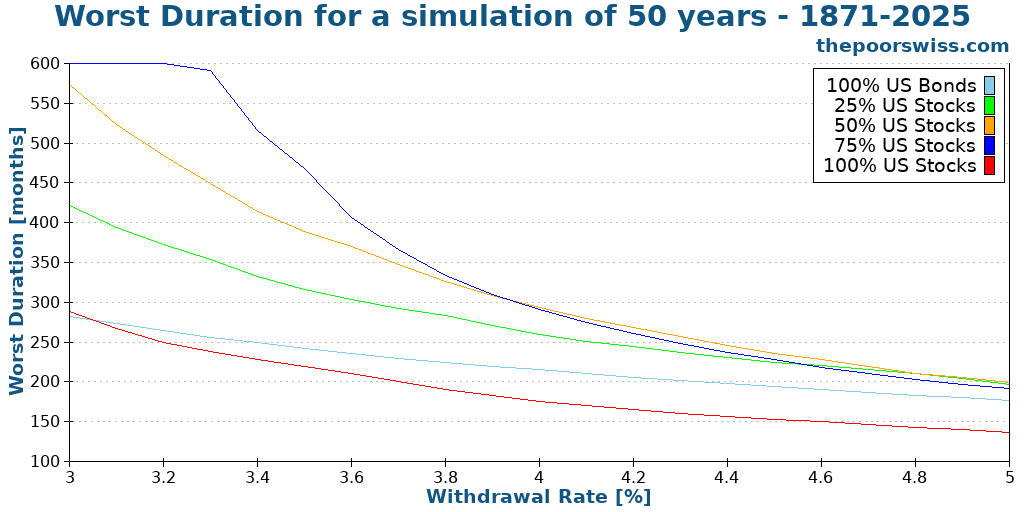
If we only look at the first graph, the conclusion is that higher allocation to stocks is always better. But if we look at the second graph, 100% stocks is the worst one!
So what does this mean: you need a balance in your portfolio. Bonds will significantly reduce the chances of your portfolio failing too early. This does not mean that you should optimize for the highest worst duration either. Because if your highest duration is 40 years, but you have only a 50% chance of reaching 50 years, this is gambling, not planning.
So balance is essential. While stocks will increase your success, stocks are more subject to sequences of return risks.
How to implement the Trinity Study?
Now that we have noted that the results of the Trinity Study are encouraging and would let people retire early, how should we implement it?
Theoretically, the Trinity Study is based on a simple concept: you can retire based on a large principal by withdrawing with a fixed withdrawal rate.
However, in practice, this means you need to accumulate money, more than most people accumulate during their lifetime. And you need to accumulate this earlier than retirement age.
To accumulate this money is not easy, but it is also not complicated. First, you have to save money (as much as possible). For this, you will have to focus on your expenses and earnings.
Then, you will have to invest that money until you can retire. Once you have accumulated the proper amount through capital gains and savings, you will be financially free.
If you are interested, I have many articles on my blog about financial independence.
How did I do it?
You can find my code and my data on Github. Everything is available to share as much as possible!
I wrote the entire program in C++. I used this programming language because it is my favorite! And it is blazing fast! I have not especially optimized my code, and it takes less than a second to generate thousands of simulations.
If you are not a coder, I also have an online FIRE calculator to do most of the calculations presented here.
My U.S. and international data is based on the data made available by Big ERN in its Safe Withdrawal Rate series. It is a good dataset that has been tested several times already. Big ERN made all this available for free. I am thankful for his work! I have completed its data with the missing years using the same methodology.
If you want to use the graphs in this article, please cite this article as the source of the image!
Future of the series
It was fascinating to reproduce these results. And it was very insightful as well. I have learned many things from the results. It is great to see the confirmation that the original conclusions hold for more than 50 years.
And it also shows that my withdrawal rate (3.5%) is a safe bet. I may switch to 3.75% in the future. I will have to run more simulations. It is important to choose a proper safe withdrawal rate.
Talking of simulations, I have run a few more simulations with the same idea:
- Trinity Study Results with Swiss Stocks
- Withdrawal rates and low-yield bonds
- When should you rebalance your portfolio?
- Does the Trinity Study work in recent years?
- How often should you withdraw money?
- Can you retire early with Swiss stocks and bonds?
- The Trinity results with world stocks
- Equity glidepaths in retirement
Since I plan to make more articles like these with more simulations, I would like to get your perspective on this article! Please let me know what you think in the comments below! What should I improve?
What do you think of these results? Would you like me to run more simulations like this? Do you have ideas on what kind of simulations I should run next?
Conclusions
With all these results, we can have several important conclusions.
First, the paper’s original conclusions still hold even with much more data being considered. And it still stands accurate up to 2026! It is excellent since it shows that the 4% rule of thumb still works!
If you increase the simulation time to more than 30 years, a 4% withdrawal rate is no longer safe. With 50 years of retirement, you have a 90% chance of success with a 4% withdrawal rate at most. A withdrawal rate of around 3.5% would be safer for most people.
If you want real chances of success, you will need more than 50% of your portfolio allocated to stocks. The stocks allow us to fight inflation and cover the withdrawal rate year after year.
If you choose a reasonable withdrawal rate, you will likely have much more money than when you started! For instance, a 3.5% withdrawal rate over 30 years with 100% stocks would leave you about six times more money than when you started!
For information about the original study, read my detailed article about the Trinity Study. If you are extremely conservative, you will also be interested in learning how to choose a failsafe withdrawal rate.
If you want to start investing to become financially independent, you will be interested in my guide on how to get started in the stock market.
More reading

Some extra income in retirement goes a long way
Planning to retire early and looking to increase your chances? Would income in retirement help your chances of success? We do the test!
Sequence of Returns Risk can ruin your retirement
Protect your retirement. Learn what Sequence of Returns Risk is and how a market crash early in retirement can destroy your portfolio.
Does the 4% rule work with low yield bonds?
Retiring with low interest? Learn how low bond yields impact safe withdrawal rates and how to adjust your FIRE strategy for a low-yield future.
Learn easy ways to optimize your finances and save thousands in Switzerland with our exclusive e-book. Learn about the most cost-effective financial services tailored for savvy residents and expats!
Get Your FREE Swiss Money-Saving Guide
Hi thanks for doing all this work. It’s very helpful.
One thing you might want to address is that the “worst case” scenarios historically have occurred in high inflation/low growth periods like mid-60’s. So if a person is retiring in a high inflation environment, they might want to reduce their withdrawal rate to the extent possible, at least for the first few years.
Thanks, Alan.
That’s a good point. I have addressed the worst duration of each portfolio, but not exactly when are the worst times. The top of a bull market is also a bad time to retire as well.
I will plan an analysis of the best and worst times to retire in a future article, thanks for the idea.
O.K. thank you. Another idea that might be worth including is trying to do some analysis with some or all of the bond allocation devoted to TIPS vs. nominal bonds, and the effect on SWR.
Using TIPS would be interesting if I can get access to the data, interesting idea!
Great job. What’s stopping us from starting the calculation from scratch when we reach, for example, 10 years of retirement? A practical example: I started retirement at age 50, and by age 60, my money had increased considerably. Can I then start calculating from that point on, changing my initial portfolio?
Hi Alexandre
Nothing is stopping you. You can reassess your situation every 10 years, no problem. And if everything goes well, you could actually increase your withdrawal rate.
But at the beginning, when you have say 40 years of retirement, you still need to plan properly for these 40 years, you should not plan to last only 10 years and then reassess.
I think this is one of those situations where probability theory can get a bit difficult to wrap your head around. If the market performance of each year is uncorrelated with prior years (I suspect that’s not true), then you can restart the analysis and reset your withdrawal amount at any time.
However, if it’s true that there are multi-year cycles in the market, and one always decides to reanalyze withdrawal after a number of boom years that have given you a higher portfolio value, then you are potentially ignoring the chance that you’ve shifted the odds towards a crash occurring in the early years of your new withdrawal amount.
Of course, that thought process perhaps also says that when considering retirement for the first time, the best analysis might include an accounting of where you are in the current multi-year cycle. And if I knew how to analyze multi-year market cycles, I’d probably be much richer than I am.
These are very good points, Michael. As you said, we never know (and are very bad at guessing) where we are in the current cycle. Even though it’s hard to tell, we should be more careful if we are high in a bull market or low in a bear market, with 100% FI ratio.
The advantage of reevaluating the situation every 10 years (arbitrary number) would potentially still be to spend a little more or a little less for the next 10 years. But as you said, we should not entirely reset.
Of course you can restart with a higher base and higher spending.
Just be aware that this exposes you again to the SORR (sequence of returns risk). This also means your failure rate will go significantly (keep in mind that the SWR is based on an initial value, and portfolio usually goes up, but if you always increase your withdrawals, then you will get hit by a market downturn).
I agree that it doesn’t make sense to stick to the initial (inflation adjusted) withdrawals if portfolio value significantly increases.
But if you adjust your withdrawals to a new portfolio value, then it’s safer to also lower the SWR a bit.
For example, initial value was 1M with 4% SWR = 40k withdrawal.
After 10 years, your portfolio value is 1.5M. I would not increase the withdrawals to 60k (4%), but maybe to 3% (45k).
Also depends on your age. If after 10 years you are 75 years old, then you could probably go for a >5% WR.
The WR should not be set in stone for 30 years.
Consider the paradoxon with 2 retirees, each having 1M and 4% WR. Person A retires in year 2025 and gets 40k. Person B waits 1 more year and markets go up by 20%. In 2026, person A will withdraw 40k (assuming 0% inflation), while person B will withdraw 48k…
Hello, what a great analysys!
Hello, what a great analysis! Does your data include SWRs below 3%?
Your data shows that success rates for 25/75 portfolio were very low for longer horizons (40Y, 50Y) and for portfolio 0/100 they were low for 30Y, 40Y and 50Y horizons.
I look for information what SWR levels provide high success rates (95% or more) in different horizons for 25/75 and 0/100 portfolios (with majority of bonds)
Hi Artur,
I don’t have any article with SWR below 3% since for most people it’s already too low. It’s true that if you have a long-term horizon and are mostly invested in bonds, you will need to go lower.
You can use my FIRE calculator to achieve what you want and use any withdrawal rate.
Thank you Baptiste. Can I kindly ask you if your calculations included taxes? For example in Poland, where I come from, we pay 19% capital gains tax. Am I right that, if I include taxes, SWR mentioned in this article should be lower?
No, taxes are not included. I only included the fees of the investment itself.
There are two ways to factor taxes into these results:
* Either you consider them as expense and you only have to factor this in your FI Number (your target)
* You factor it directly into the simulations, and you would have to change your withdrawal rate
I usually recommend the first option because it’s much simpler :)
Thanks a lot for all your effort on this Trinity Study.
I had a look at your source. Regarding stocks, from what I could see you use the Schiller data. However, looking at the schiller data and comparing to your stocks data, I couldn’t quite understand where you got the value data from? Shouldn’t it be the Real Total return price per month?
My question has to do with the impact of US Social Security income to your portfolio. Lets say I have $2M in investments and at 68, SS would be $50K now, but $57K if I wait unitl 70. For simplicity, I value my SS using 4%, i.e.$50K is like an investment of $1.25M, albeit it will never go down, but nor is it an asset to my estate. $2M investments plus $1.25M SS at 4% indicate $130K/year. At 70, the SS will be like $1.425 of an asset. So here is a ‘strategy’ to consider: Pull out 6.5% or $130K from the $2M for now, then at 70 when i get the $57K, throttle it back to $73K or 3.65% of the $2M. Perhaps revist the $130K number, since the SS would be about $200K higher. Anyway, the bigger question is when on has fixed payments, how can those be factored into this analysis in three areas – combined valuation, a two tiered approach to timing, and as a safety floor versus having no assets.
I would be extremely careful about pulling 6.5% for any amount of years. You can definitely factor social security into your retirement plan. However, you need to be extra careful that it may not follow inflation and that it may not be as large as you expect. If you are far away from retirement, it is difficult to factor it in since it’s quite risky.
I wrote an article about this, hopefully you can find some value: Early retirement and social security
Hi, some more questions!
1. For the success rate definition you write “percentage of the months that end up with success” – but don’t you mean the percentage of scenarios? E.g. if you ran 5,000 scenarios, each one projecting the next 30 years, you would only need to look at the last column of the projection to count how many times we ended up with zero at year 30 and then divide by 5000?
2. What inflation rate did you use on the withdrawals?
3. Why do you say that modelling on a monthly basis is superior to annual?
I made my own model using normal and t distributions with 10% expected return and 20% standard deviation calibrated to SP500 data, and could not get above 90% success rate on a 4% withdrawal rate. I think my success rate was lower due to heavier tails of those distributions, and also I allowed for some autocorrelation for the ‘sequence of returns’ risk. Also put in dynamic withdrawals which got me an extra 2-5% success, but the success rate was more driven by the volatility of the returns.
Hi James,
1) I mean the percentage of starting months, hence it’s the staame as scenarios.
2) US inflation rate
3) because we have 12 times more data if we use monthly data and 12 times more scenarios.
I would think it’s difficult to truly model the returns, it’s simpler to use the real returns.
One thing to add, and probably worth a blog post from you, is that the SWR do not account for fees/costs.
And in Switzerland, we have a specific situation that is not taken fully into account in the Trinity study:
– TER (running costs) of ETF (assume 0.2%)
– Wealth tax (assume another 0.2%)
– US tax on dividends (dividend yield is maybe 2%, US withhold tax is 30% of which 15% is returned to ETF if domicile is Ireland (assume 0.3%)
So we end up with 0.7%, which is significant. If you use a SWR of 3.75% to play it save, in reality, that’s just a 3% SWR or 20% less, pretty massive.
I’d be interested in your thoughts about this – as I wrote maybe it’s worth a blog post. Thank you!
Each Country would have its own taxes/fees. I’ve always assumed the 3.75 to be net of taxes depending on what country you live and what type of account.
(Ie if Canada, AND money is held in registered pension account, one will see income tax around 40% on any withdrawl. But if held in TFSA, no taxes on principle nor income gain)
Hi Marco,
I do take fees into account. All my simulations are done with 0.1% fees.
The US tax on dividend can fully avoided with a US ETF, so I think it’s fine to not take it into account.
But for me, wealth tax should be more part of the expenses (hence of your target).
If you want, you can use my advanced FIRE calculator to change the fees.
I can think about playing with fees in an article, but I feel like it would be a bit flat (more fees = less success)
This is a really interesting analysis. To me, the thing that all such analysis misses is the impact of variable withdrawals. As is demonstrated by the median values at the end of the simulation, very low withdrawal rates tend to result in dying with a lot of money. The most economically efficient plan would result in a very low chance of failure, and dying with exactly $0 dollars left. Given the inherent unpredictability of financial returns, that would seem to argue for crafting a strategic for varying withdrawals. For people retiring with barely enough money, maybe a fixed rate is a good plan. But lots of us may have more substantial assets, and we might like to enjoy that, while also having the ability to engage in substantial belt tightening during periods of low financial returns.
Hi Michael
It is true that the safer you plan to be, the more likely you are to end up with a lot of money.
I have covered variable withdrawals in other articles:
* Can you withdraw 4% of your current portfolio?
* Should you use a dynamic withdrawal rate?
It’s true that people can be flexible. However, people generally highly overestimate their capacity to turn spending down. So flexibility can be very dangerous.
Very interesting.
I would still be cautious with the 4% rule given possible upcoming crises with longterm effects (wars, inflation, government debts …) for the coming years.
On the other hand the strategy is nice because the annual withdrawal can handily be reduced if something happens, only the target total asset wealth would then be made invalid for life planning, possibly.
To live a modest life, check the budget, invest early and diversified to strive for quick accumulation of high assets seems very sound, this quite independent from FIRE strategies.
(just my thinking)
Hi Frankie,
I agree that 4% may be at risk. And it’s not fully safe withdrawal rate. There were indeed periods where it would have failed (compared to a failsafe withdrawal rate).
Flexibility helps but if often overestimated.
Do you aim to retire with this method?
Hi, Baptiste.
No, to rely on FIRE for life planning, would seem to risky from my point of view. I retired early at age 58 last year to care for dependent family members in Germany (living in the family house, situation “Hand gegen Koje”), the early-pension funds could not suffice now. At age 65 and 67 additional pension funds would be paid out and suffice (I hope) for a modest life. I was able to accumulate (and let grow) from younger age on equity assets that are ok, but I hope I can keep them untouched. I could imagine to buy a 100% paid down house after retirement from a bigger chunk of the assets. It would then help to relocate to CH because of the better capital gains tax situation and because CH is more beautiful & safer anyway.
FIRE could still be implemented, though, if the total assets grow, at a later point in life, but not my primary strategy.
good luck, und gute Besserung für den Rückenschmerz (2nd most common family doctor complaint.)
Hi Frankie
Thanks for sharing your strategy/life!
Good luck taking care of your dependent.
I have pretty much given up on “fixing” entirely my back pain, it’s there to stay.
Great article, and really clear explanations. Very well done and thank you for sharing (I am sure this took a lot of time!).
I realize everyone has a different comfort zone; for me personally, I think that a 90% success rate is too high (withdrawal rate too low). 90% means you are likely end up with way more in the end where you could have enjoyed it more at the beginning (when you can likely most take advantage of it). I personally aim for 75%, with the caveat to consider reducing my withdrawal rate in the bad return year(s). Of course, everyone has a different safety zone.
Thanks again for your insightful posts!
Yes, there are definitely different zones. Some people need 100% success rate to start while others are perfectly fine with something like 75% (like you). And someople are in the middle, like me, with odds around 85%-90%.
And it’s true that the more conservative you are, the higher chances of ending up with a lot of money.