Trinity Study with world stocks in 2026
| Updated: |
(Disclosure: Some of the links below may be affiliate links)
I have done many early retirement simulations based on the well-known Trinity Study. But until now, I have only considered either US or Swiss stocks. Since most investors should aim for more diversification, they will usually have some international stocks in their portfolio.
So, we will redo our early retirement simulations with world stocks. With that, we can see whether international stocks performed well historically for early retirement. And we can also compare them with US stocks only.
World Stocks
I recently added world stocks to my simulation toolkit. For more information about this toolkit, you can read my original Trinity Study article.
The data I have for world stocks is the standard World ex-US data. This means it contains stocks from the entire world, except for the US. So, we will need to fit US stocks into it in this article because the United States makes up more than half of the global stock market.
Unfortunately, the new data is still relatively limited. I was only able to find data from 1970 to 2023. From 1871 to 2023, the returns of world stocks followed the returns of US stocks. Everything is priced in USD.
In the future, I wish to find more historical data before 1970. But in the meantime, I thought this would already yield some interesting results.
The simulations
Again, I will run my usual Trinity Study simulations. Since all my data is monthly, I test each possible starting month in the dataset. The simulation is run with monthly inflation, withdrawals, and returns for each of these starting points.
At the end of the period, if the portfolio still has some money, it is considered a success; it is a failure. So, once all starting points are evaluated, we can get an average success rate, which tells us how likely it is to finish retirement successfully.
All simulations are using these parameters:
- The portfolio is rebalanced yearly
- All withdrawals are made monthly
- US inflation is taken into account
- A TER of 0.1% is taken into account
ex-uS Stocks Only
First, we will use only world stocks (meaning no US stocks). A duration of 30 years is a good place to start with.
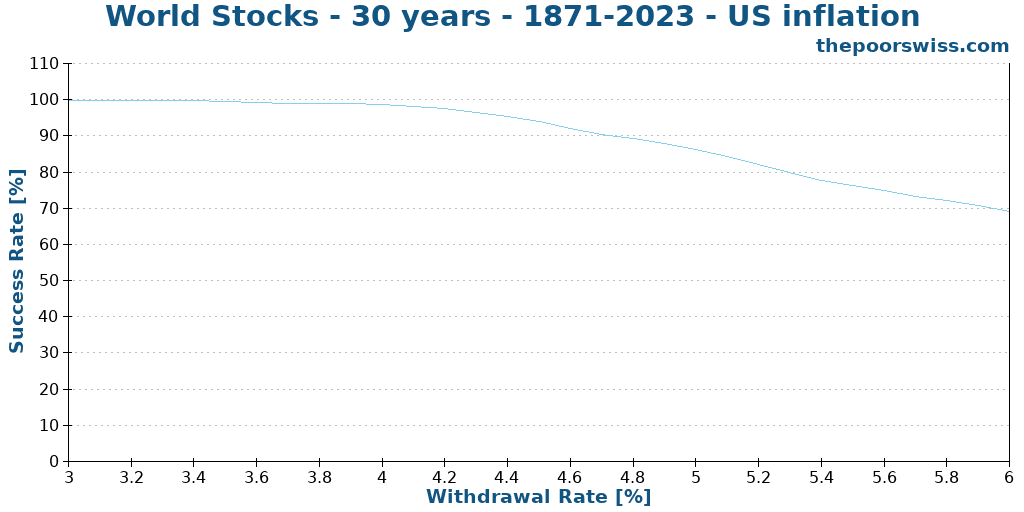
We can see that over 30 years, using ex-US stocks would have been very safe even with a more than 4% withdrawal rate.
Many people use a combination of stocks and bonds. Unfortunately, I do not have any historical data on ex-US bonds. So, I will use US bonds instead. That way, we can check different portfolios. So, here is the same graph but with a different combination of portfolios.
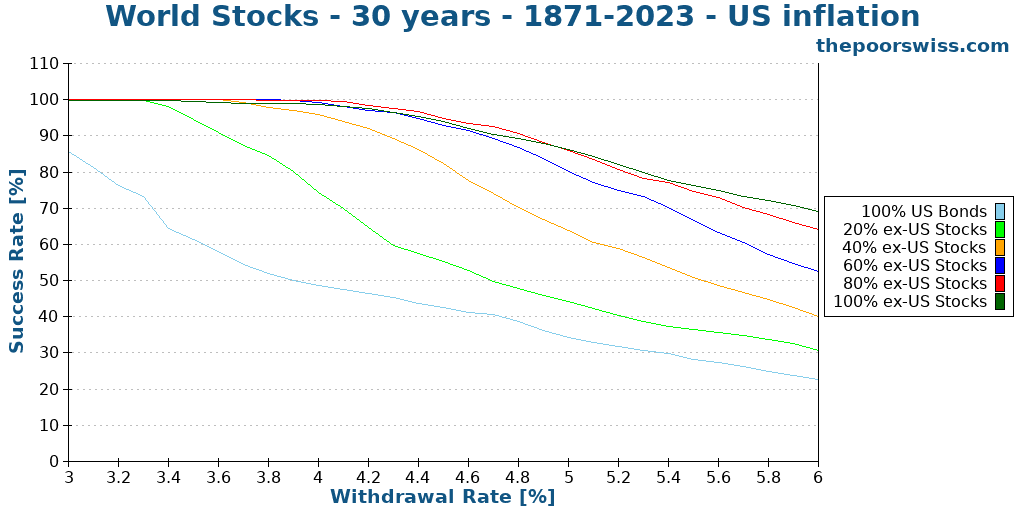
As expected, using an allocation to stocks lower than 60% yields poor results. However, it is interesting that the results are fairly similar to those of US stocks. We would get a decent success rate even with a 5% withdrawal rate.
Generally, 30 years of retirement is easy to sustain with most portfolios. However, it is more interesting to examine longer retirement periods. So, we can examine the results for 40 years.
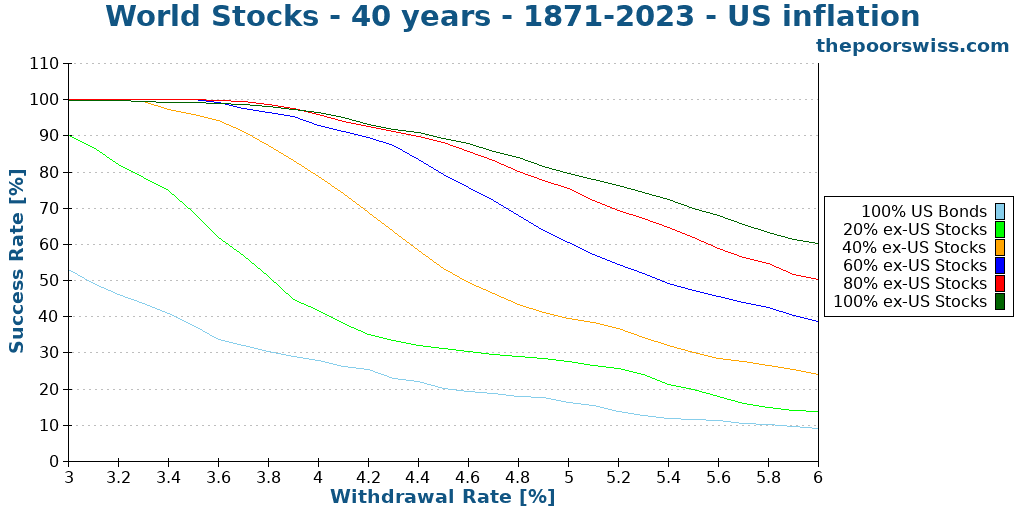
At a 4% withdrawal rate, we would still get more than a 90% success rate with at least 60% in stocks. Any portfolio below that amount of stocks should use a lower withdrawal rate.
We will also look at 50-year retirements.
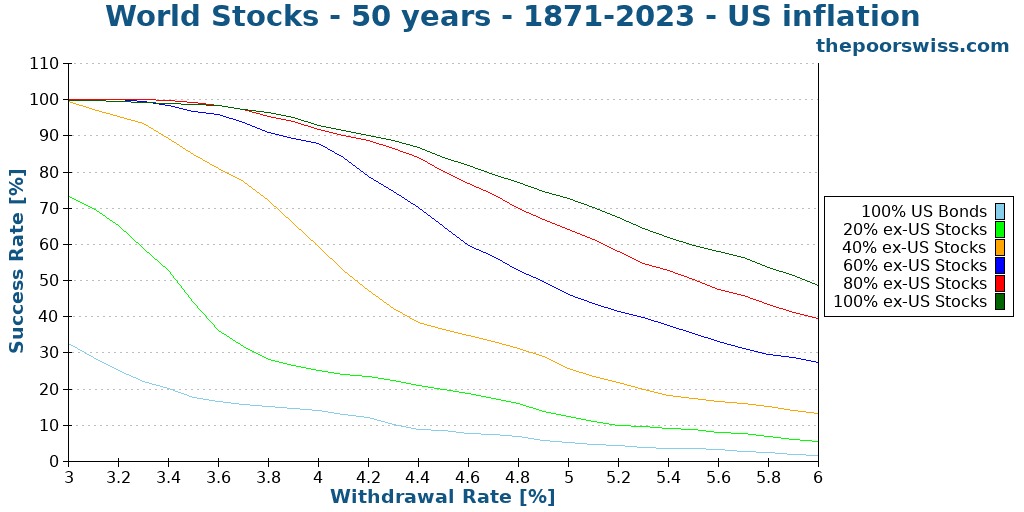
As expected, the returns are all lower. As expected, the best results are always obtained using 100% stocks. This does not mean bonds are useless; bonds will have better results when we look at the worst duration. But for success rate only, stocks excel.
So far, this shows that using ex-US stocks and US bonds can lead to excellent results, even with the 4% withdrawal rate.
World Stocks and US Stocks
World stocks are really interesting, but in our case, we only considered ex-US stocks. So, to fully cover the world stock market, we need to combine ex-US stocks with US stocks.
In theory, we should not have to find the proper allocation to each. Indeed, we can use indexing to choose the appropriate allocation. Currently, the US represents about 60% of the world stock market. So, this is what most index investors use. However, we can check both groups independently and test different portfolios since we have the data.
So, we start with 30 years of retirement again.
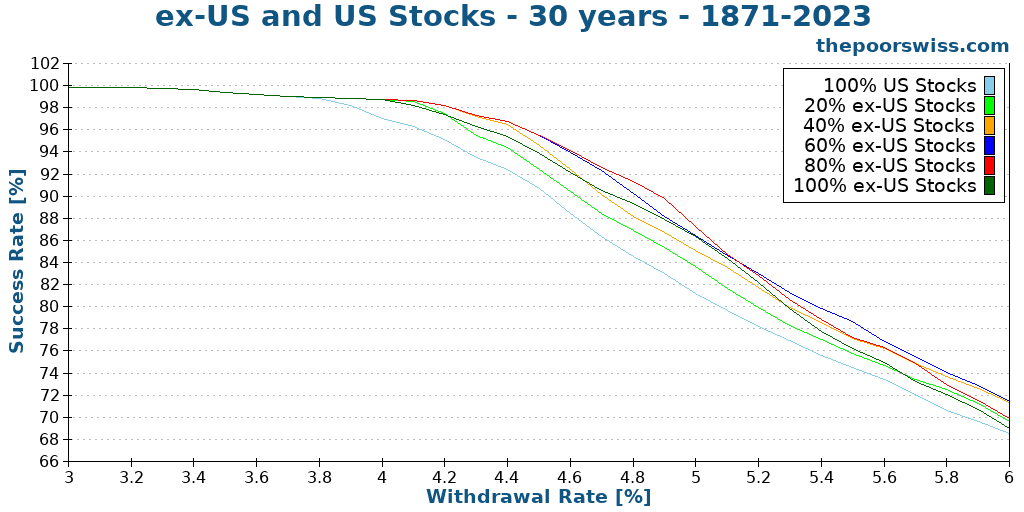
The first interesting fact we can extract from these results is that the worst portfolio uses 100% US stocks. This is surprising because I was expecting US stocks to be the best since they usually have higher-than-average returns. But this is a good sign for diversification!
The other interesting fact is that the 100% ex-US stocks portfolio is not the best. I was expecting that, but it is, again, good news for diversification.
We can also see that the results before the 4% withdrawal rate are very similar, not enough to distinguish between these different portfolios. The results with higher withdrawal rates are more interesting.
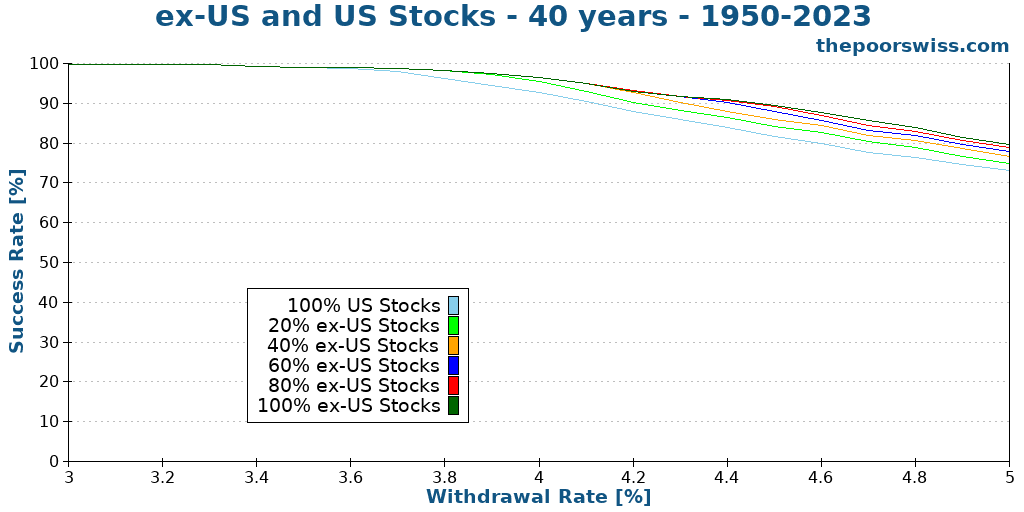
But before we compare these in detail, we should see what happens with 40 years to distinguish differences better. I also reduced the maximum withdrawal rate to 5% to make this more visible. This withdrawal rate is already very aggressive, so going further is very unlikely.
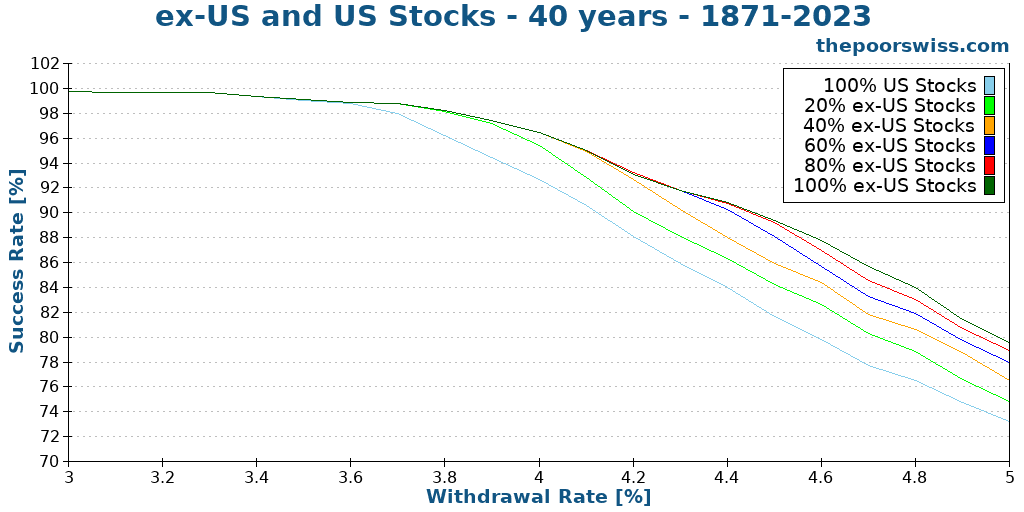
We can see that the same conclusions mostly hold true for retirement that last 40 years. The portfolio with 100% US stocks is still the worst portfolio for success rate.
However, after the 4.4% withdrawal rate, the 100% ex-US stocks portfolio becomes the best by a few percent success rate. There are also slightly more differences between the different portfolios.
Finally, we can expand that test to 50 years of retirement.
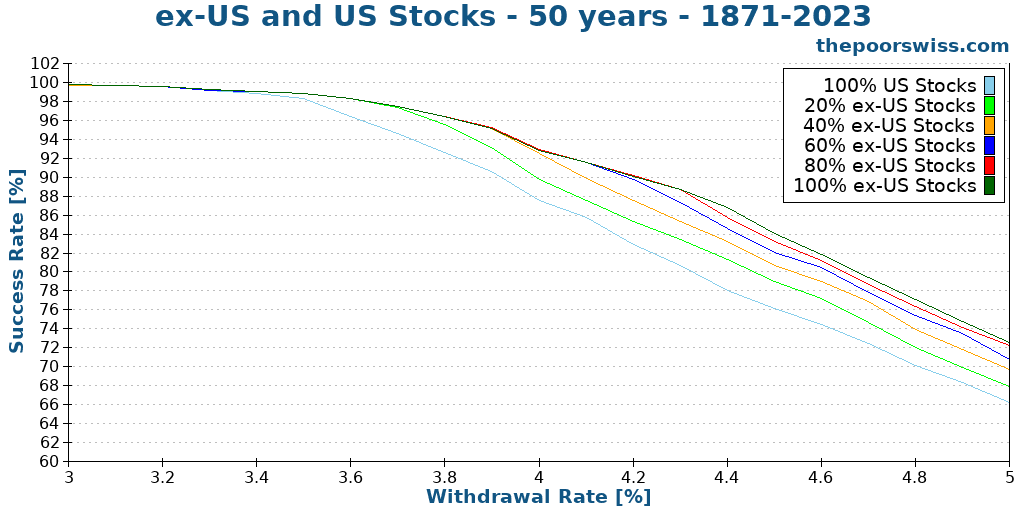
We can see that the worst portfolio remains the portfolio with only US stocks. Also, if you stay below the 4% withdrawal rate, any portfolio with at least 40% ex-US stocks is more or less the same. Above that, differences start to increase between the different portfolios.
It is essential to mention that with such a long retirement, almost every test will start before 1970, this means that most of the simulations start in periods where there is no difference in data and the differences will then mostly come from ending in the period with historical data for ex-US stocks.
Even though we only have a short time range, we can still see that ex-US stocks are very interesting. We can get very good performance by using at least 40% ex-US stocks in the portfolio.
Shorter periods
Since my dataset for ex-US stocks is pretty limited, I also wanted to explore shorter periods to see if the differences between US and ex-US stocks get bigger. Therefore, I reran my experiments for the 1950-2023 period.
We can start with 30 years of retirement in that period.
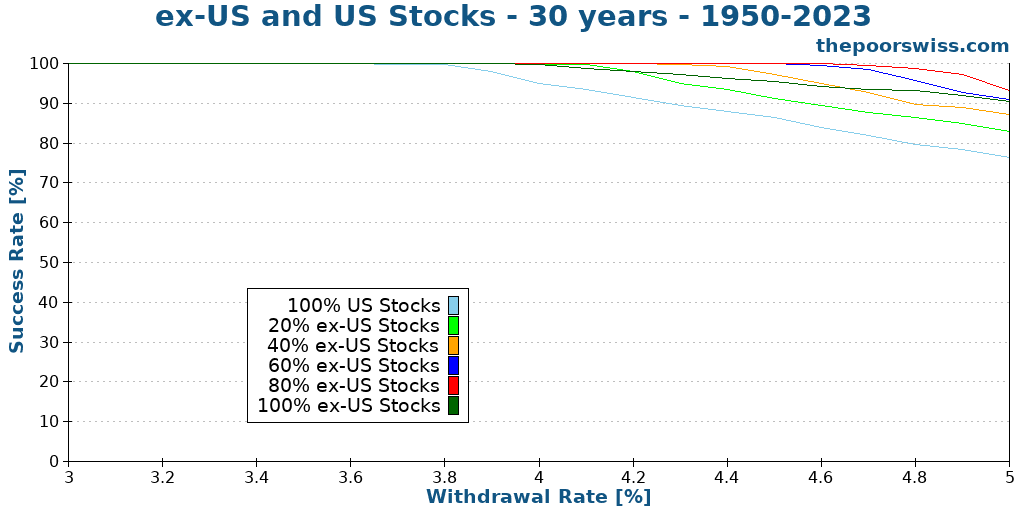
As expected, the order of the different portfolios is the same as before. However, what is interesting is that the differences between the results are larger than before.
We can see that adding ex-US stocks to the portfolio can significantly improve success rates. For instance, at a 4% withdrawal rate, adding 20% ex-US already brings up the success rate by 4%.
At a 5% withdrawal rate, adding 20% ex-US stocks adds about 7% success rate. Adding 80% ex-US stocks adds more than a 15% success rate. These are very significant differences.
Of course, 30 years of retirement is relatively short, and it is easy to get good success rates. So, we should see the differences over 40 years.
The results have flattened a bit in this case. Nevertheless, the differences are still more significant than they were when considering the entire period. At 5% withdrawal rate, there is a 10% success rate difference between 0% and 100% ex-US stocks. And at a 4% withdrawal rate, there is still a 6% difference.
When planning for a long retirement, these differences can matter.
Historical returns compared
To understand better these results, we can look at the historical returns of our three asset classes. Since the word stocks data has only been available since 1970, I plotted the data from 1970 to 2023.
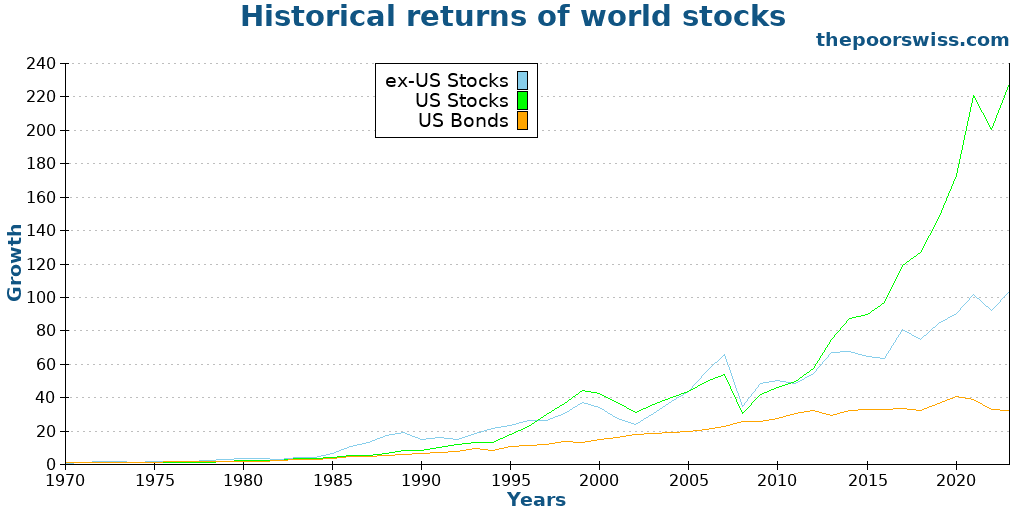
These results are extremely interesting. Most people believe that US stocks will outperform international stocks significantly. However, this vast outperformance was only present in the last ten years, from about 2013 to 2023. Before that, world stocks performed more or less at the same level as US stocks (at least since 1970).
So, having world stocks before 2013 did not mean losing much in return. Significant outperformance since 2013 may not last much longer. This reassures me that full diversification into world stocks is better than a large allocation to US stocks.
Of course, as the value of US stocks grows quickly, so does its weight in World stocks. So, market capitalization-weighted indexes still include a significant bias toward the United States.
Conclusion
Although we have limited historical data, it still looks like international stocks are working quite well. Historically, ex-US stocks have had good results. Mixing ex-US and US stocks yields excellent performance for early retirement.
The trend reversed in the last ten years or so. Indeed, in this last decade, US stocks have strongly outperformed non-US stocks. But since we do not know the future of stocks, ten years’ outperformance is irrelevant.
Even though some results seem to suggest that ex-US stocks are better than US stocks for early retirement, we should not focus on a full ex-US portfolio either. The US is a very significant part of the world stock market, and we should not ignore it.
For me, this confirms the need to diversify internationally. I feel safer having both US and ex-US stocks in my portfolio, on top of my home bias. This makes a strong case for international diversification.
What do you think about these results? Do you have any suggestions on the next retirement simulation I should do?
More reading

Grow Your Income or Spend Less to Reach FIRE in 2026?
Reach Financial Independence faster. Learn why growing your income is just as important as spending less and how to widen the gap to save more.
9 Reasons to Aim for Financial Independence
Why pursue Financial Independence? Discover the benefits of FIRE, from freedom and flexibility to reducing stress and owning your time.
How to Calculate your Financial Independence (FI) Ratio
How you can compute your ratio to Financial Independence (FI). How to use Safe Withdrawal Rate (SWR) to see how much you need to save.
Learn easy ways to optimize your finances and save thousands in Switzerland with our exclusive e-book. Learn about the most cost-effective financial services tailored for savvy residents and expats!
Get Your FREE Swiss Money-Saving Guide
Hi! First of all congratulations for your work it Is very useful for all of us! I have a question: i live in Italy and my portfolio is 50% ETF VWCE Vanguard (International stocks including of course USA and emerging markets) and 50% euro governative bonds (ETF XGLE,plus some single euro next gen bonds)
So i have change exposure for the stocks allocation (mainly to US dollar) but no for the bonds allocation
Do you think in my case the Safe Withdrawal rates series you wrote are ok or should i modify them as they are for US investors? I am very interested in particular in failsafe w.r.
I am using a very conservative s.w.r. of 2,75% (that becomes a 2% net after Italian withdrawal taxes
Thank you very much!!!
Hi Marco
You cannot expect all the results to be the same if you are changing the bonds to be EUR bonds since they did not have the same returns as US bonds. On top of that, you would need to consider EUR/USD exchange rate as well.
That being said, in all my testing, 2.75% withdrawal rate is extremely safe. And the results should apply fairly cleanly to your stocks. But the only way to be sure would be to get the data for euros bonds and do the simulations.
Thank you very much for your answer! I don’t know if i will find those data for euro bonds i think i will take the risk also because,a part from the capital from which i can live with 2%net i also have 150k of liquidity on my bank account that could help me if i am very unlike with sequence of risk return! Thank you again and talk to you soon!
If i am very unlucky
“However, it is interesting that the results are fairly similar to those of US stocks.”
IIUC you’re using the same data for ~2/3 of the time window so it’s not interesting that the results are fairly similar. I’d be very surprised if they were different. Given that assumption, I think the graphs starting from 1870 are pretty much useless because they say nothing about international stocks in most of the time period. They could also be misleading because this assumption is easy to miss.
But I can also be missing something here.
This is intended as a direct comment on a method, not a harsh criticism of the work you’re doing. I really appreciate what you’re putting out there for everybody to use :)
Even for 2/3 similarity, I was expecting more difference, that’s all.
I have made the information quite clear in the article in multiple places. If people don’t read the whole article, it will be their loss, not mine. Of course, it would be better to have more historical data, but I don’t have the means to collect it.
I think, with Your mindset, modesty and investing bandwith you’r doing already everything right.
best wishes,
FrankieS
Thanks :)
shorter term single year, maybe interesting,
cursor can be moved to the country logo to highlight the country only.
https://novelinvestor.com/international-stock-market-performance/
Yes, definitely difficult to find monthly returns on the long run. That’s why it took me a while to get that article done.
This list is definitely interesting. I wonder why Denmark saw such a nice return.
oh, sorry, no, not me.
difficult topic anyway: datasets, inflation adjusting, etc.
bye
thank you
edited-local-link
in these annual reports there were country specific averaged stock market longterm % annual returns.
The link you posted points to your file system, not to the internet, we can’t read it :)
gosh
I’ll try again
https://www.ubs.com/global/en/investment-bank/in-focus/2024/global-investment-returns-yearbook/_jcr_content/mainpar/toplevelgrid/col1/innergrid/xcol2/actionbutton_copy.0474491116.file/PS9jb250ZW50L2RhbS9hc3NldHMvaWIvZ2xvYmFsL2luLWZvY3VzL2RvYy91YnMtZ2xvYmFsLWludmVzdG1lbnQtcmV0dXJucy15ZWFyYm9vay0yMDI0LXN1bW1hcnktZWRpdGlvbi5wZGY=/ubs-global-investment-returns-yearbook-2024-summary-edition.pdf
the other:
https://novelinvestor.com/international-stock-market-performance/
Yes, the UBS yearbook are really nice for that (used to be Credit Suisse). Unfortunately, they use the DMS database, which costs 4000 GBP per year.
Maybe a country subgroup longterm analysis of the ex-U.S. stocks could be interesting.
I assume that the ‘developed’ market countries should lead besides U.S. ?
bye, thanks,
FrankieS
Hi Frankie
That would be good, but that woudl require data I don’t have. If you know whether to find long-term historical monthly returns for many countries, I am interested!