Trinity-Studie mit globalen Aktien in 2026
| Aktualisiert: |
(Offenlegung: Einige der unten aufgeführten Links können Affiliate-Links sein)
I have done many early retirement simulations based on the well-known Trinity Study. But until now, I have only considered either US or Swiss stocks. Since most investors should aim for more diversification, they will usually have some international stocks in their portfolio.
So, we will redo our early retirement simulations with world stocks. With that, we can see whether international stocks performed well historically for early retirement. And we can also compare them with US stocks only.
World Stocks
I recently added world stocks to my simulation toolkit. For more information about this toolkit, you can read my original Trinity Study article.
The data I have for world stocks is the standard World ex-US data. This means it contains stocks from the entire world, except for the US. So, we will need to fit US stocks into it in this article because the United States makes up more than half of the global stock market.
Unfortunately, the new data is still relatively limited. I was only able to find data from 1970 to 2023. From 1871 to 2023, the returns of world stocks followed the returns of US stocks. Everything is priced in USD.
In the future, I wish to find more historical data before 1970. But in the meantime, I thought this would already yield some interesting results.
The simulations
Again, I will run my usual Trinity Study simulations. Since all my data is monthly, I test each possible starting month in the dataset. The simulation is run with monthly inflation, withdrawals, and returns for each of these starting points.
At the end of the period, if the portfolio still has some money, it is considered a success; it is a failure. So, once all starting points are evaluated, we can get an average success rate, which tells us how likely it is to finish retirement successfully.
All simulations are using these parameters:
- The portfolio is rebalanced yearly
- All withdrawals are made monthly
- US inflation is taken into account
- A TER of 0.1% is taken into account
ex-uS Stocks Only
First, we will use only world stocks (meaning no US stocks). A duration of 30 years is a good place to start with.
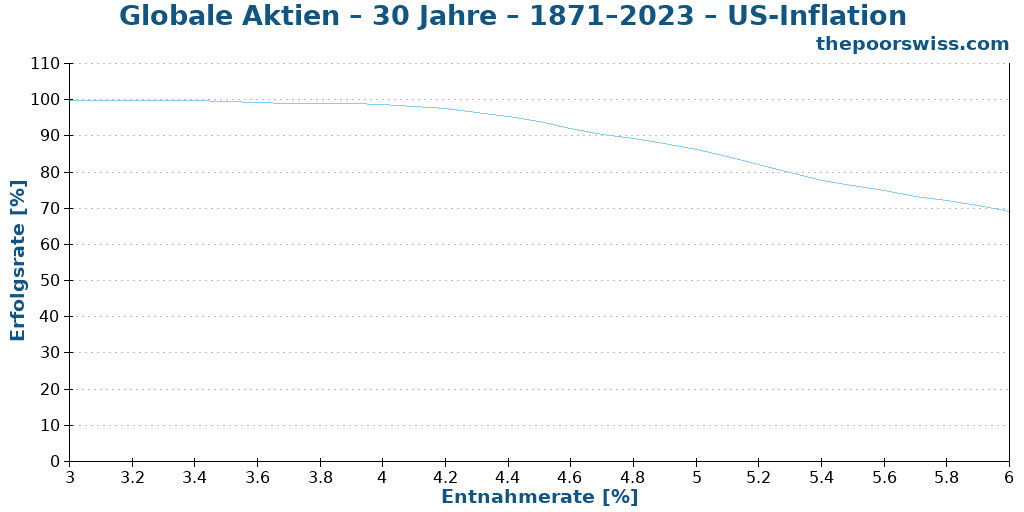
We can see that over 30 years, using ex-US stocks would have been very safe even with a more than 4% withdrawal rate.
Many people use a combination of stocks and bonds. Unfortunately, I do not have any historical data on ex-US bonds. So, I will use US bonds instead. That way, we can check different portfolios. So, here is the same graph but with a different combination of portfolios.
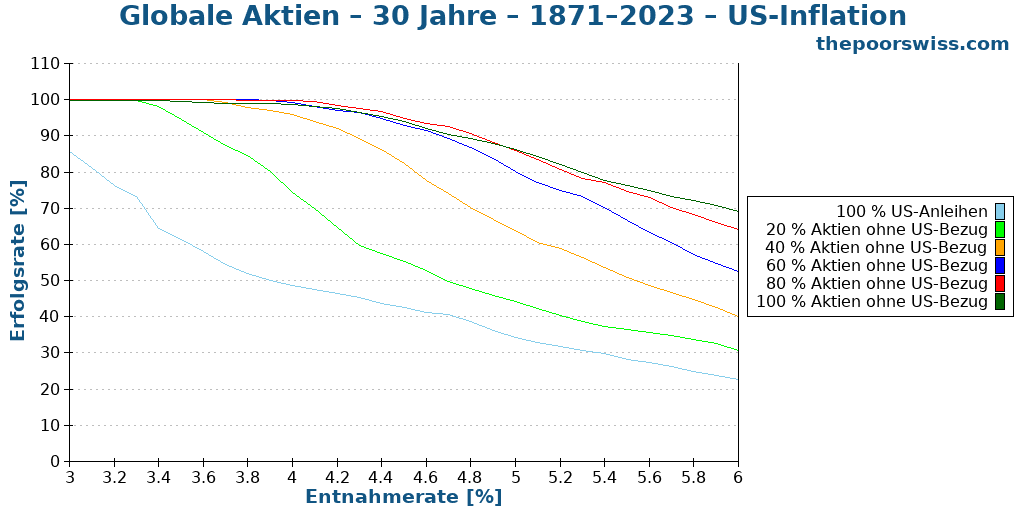
As expected, using an allocation to stocks lower than 60% yields poor results. However, it is interesting that the results are fairly similar to those of US stocks. We would get a decent success rate even with a 5% withdrawal rate.
Generally, 30 years of retirement is easy to sustain with most portfolios. However, it is more interesting to examine longer retirement periods. So, we can examine the results for 40 years.
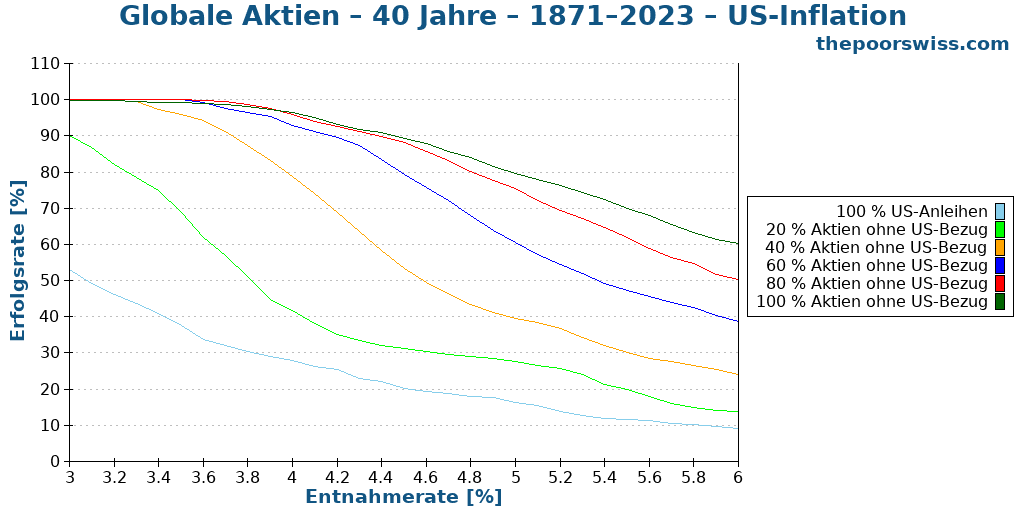
At a 4% withdrawal rate, we would still get more than a 90% success rate with at least 60% in stocks. Any portfolio below that amount of stocks should use a lower withdrawal rate.
We will also look at 50-year retirements.
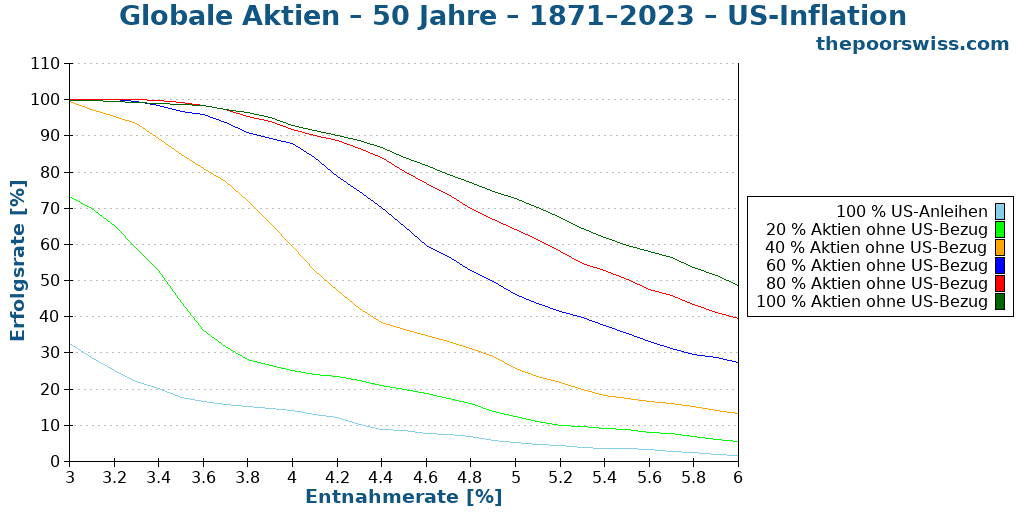
As expected, the returns are all lower. As expected, the best results are always obtained using 100% stocks. This does not mean bonds are useless; bonds will have better results when we look at the worst duration. But for success rate only, stocks excel.
So far, this shows that using ex-US stocks and US bonds can lead to excellent results, even with the 4% withdrawal rate.
World Stocks and US Stocks
World stocks are really interesting, but in our case, we only considered ex-US stocks. So, to fully cover the world stock market, we need to combine ex-US stocks with US stocks.
In theory, we should not have to find the proper allocation to each. Indeed, we can use indexing to choose the appropriate allocation. Currently, the US represents about 60% of the world stock market. So, this is what most index investors use. However, we can check both groups independently and test different portfolios since we have the data.
So, we start with 30 years of retirement again.
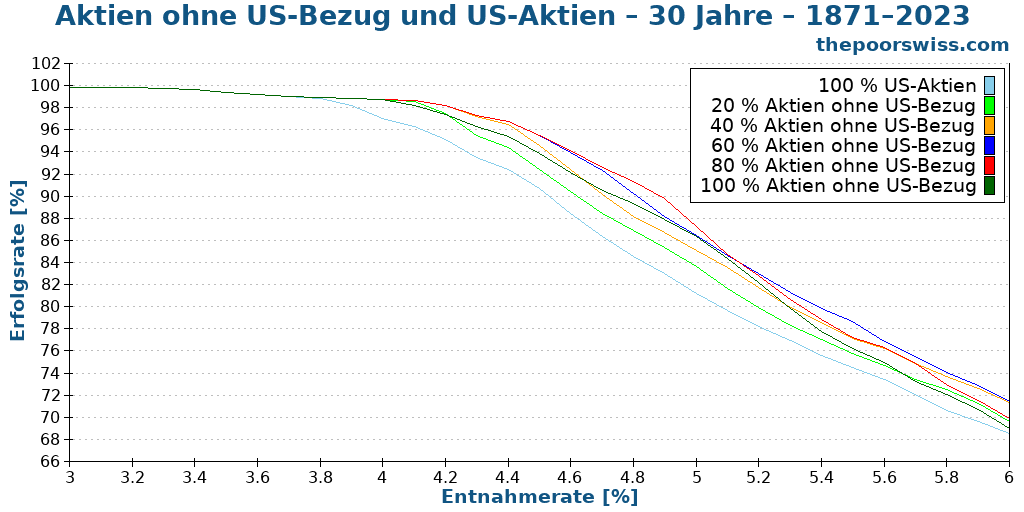
The first interesting fact we can extract from these results is that the worst portfolio uses 100% US stocks. This is surprising because I was expecting US stocks to be the best since they usually have higher-than-average returns. But this is a good sign for diversification!
The other interesting fact is that the 100% ex-US stocks portfolio is not the best. I was expecting that, but it is, again, good news for diversification.
We can also see that the results before the 4% withdrawal rate are very similar, not enough to distinguish between these different portfolios. The results with higher withdrawal rates are more interesting.
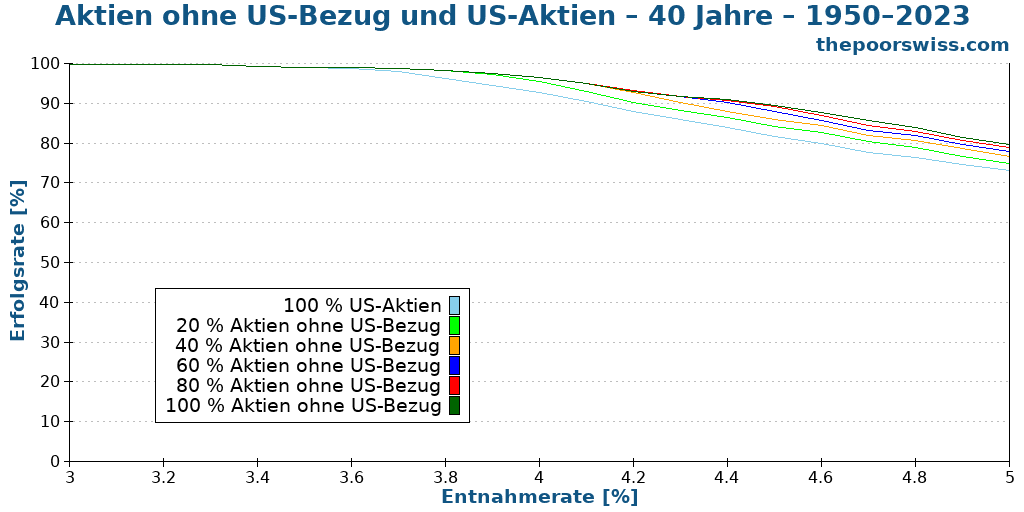
But before we compare these in detail, we should see what happens with 40 years to distinguish differences better. I also reduced the maximum withdrawal rate to 5% to make this more visible. This withdrawal rate is already very aggressive, so going further is very unlikely.
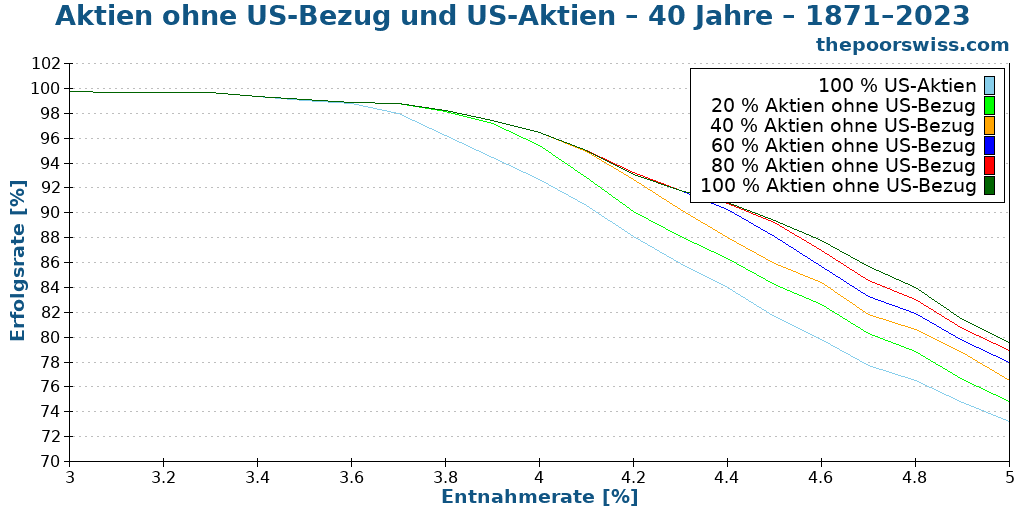
We can see that the same conclusions mostly hold true for retirement that last 40 years. The portfolio with 100% US stocks is still the worst portfolio for success rate.
However, after the 4.4% withdrawal rate, the 100% ex-US stocks portfolio becomes the best by a few percent success rate. There are also slightly more differences between the different portfolios.
Finally, we can expand that test to 50 years of retirement.
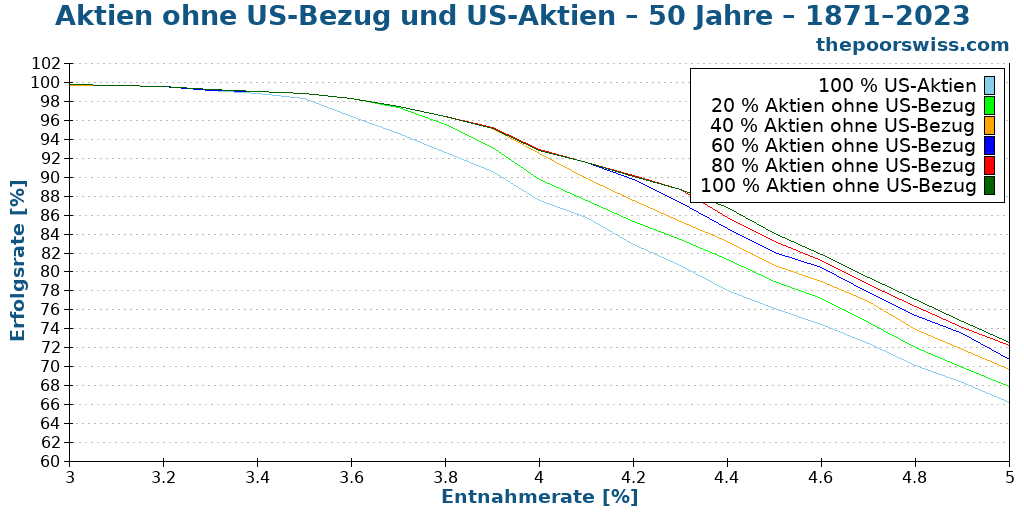
We can see that the worst portfolio remains the portfolio with only US stocks. Also, if you stay below the 4% withdrawal rate, any portfolio with at least 40% ex-US stocks is more or less the same. Above that, differences start to increase between the different portfolios.
It is essential to mention that with such a long retirement, almost every test will start before 1970, this means that most of the simulations start in periods where there is no difference in data and the differences will then mostly come from ending in the period with historical data for ex-US stocks.
Even though we only have a short time range, we can still see that ex-US stocks are very interesting. We can get very good performance by using at least 40% ex-US stocks in the portfolio.
Shorter periods
Since my dataset for ex-US stocks is pretty limited, I also wanted to explore shorter periods to see if the differences between US and ex-US stocks get bigger. Therefore, I reran my experiments for the 1950-2023 period.
We can start with 30 years of retirement in that period.
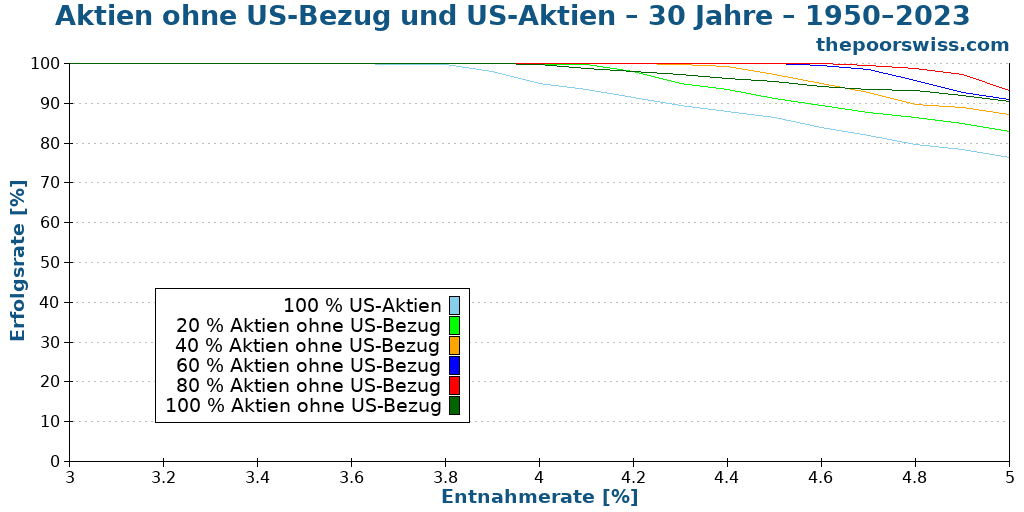
As expected, the order of the different portfolios is the same as before. However, what is interesting is that the differences between the results are larger than before.
We can see that adding ex-US stocks to the portfolio can significantly improve success rates. For instance, at a 4% withdrawal rate, adding 20% ex-US already brings up the success rate by 4%.
At a 5% withdrawal rate, adding 20% ex-US stocks adds about 7% success rate. Adding 80% ex-US stocks adds more than a 15% success rate. These are very significant differences.
Of course, 30 years of retirement is relatively short, and it is easy to get good success rates. So, we should see the differences over 40 years.
The results have flattened a bit in this case. Nevertheless, the differences are still more significant than they were when considering the entire period. At 5% withdrawal rate, there is a 10% success rate difference between 0% and 100% ex-US stocks. And at a 4% withdrawal rate, there is still a 6% difference.
When planning for a long retirement, these differences can matter.
Historical returns compared
To understand better these results, we can look at the historical returns of our three asset classes. Since the word stocks data has only been available since 1970, I plotted the data from 1970 to 2023.
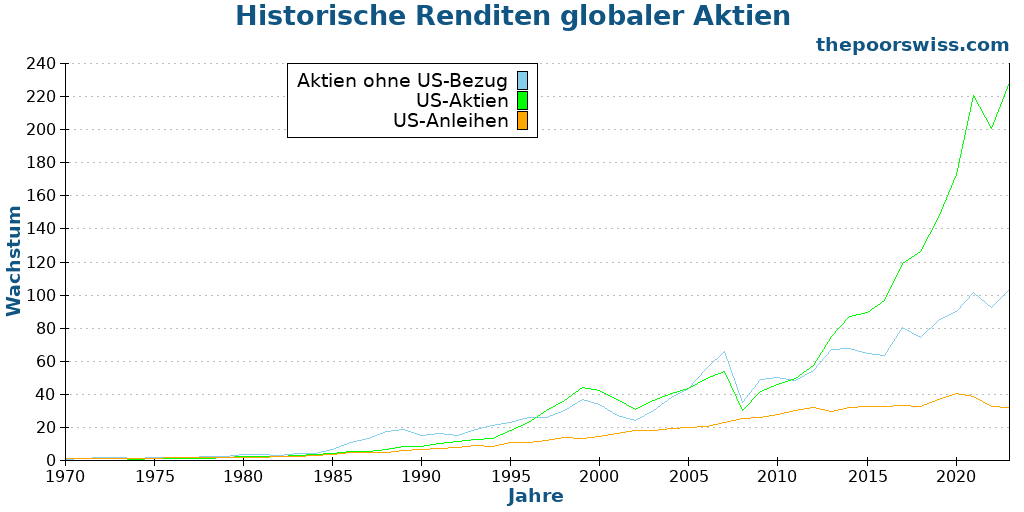
These results are extremely interesting. Most people believe that US stocks will outperform international stocks significantly. However, this vast outperformance was only present in the last ten years, from about 2013 to 2023. Before that, world stocks performed more or less at the same level as US stocks (at least since 1970).
So, having world stocks before 2013 did not mean losing much in return. Significant outperformance since 2013 may not last much longer. This reassures me that full diversification into world stocks is better than a large allocation to US stocks.
Of course, as the value of US stocks grows quickly, so does its weight in World stocks. So, market capitalization-weighted indexes still include a significant bias toward the United States.
Conclusion
Although we have limited historical data, it still looks like international stocks are working quite well. Historically, ex-US stocks have had good results. Mixing ex-US and US stocks yields excellent performance for early retirement.
The trend reversed in the last ten years or so. Indeed, in this last decade, US stocks have strongly outperformed non-US stocks. But since we do not know the future of stocks, ten years‘ outperformance is irrelevant.
Even though some results seem to suggest that ex-US stocks are better than US stocks for early retirement, we should not focus on a full ex-US portfolio either. The US is a very significant part of the world stock market, and we should not ignore it.
For me, this confirms the need to diversify internationally. I feel safer having both US and ex-US stocks in my portfolio, on top of my home bias. This makes a strong case for international diversification.
What do you think about these results? Do you have any suggestions on the next retirement simulation I should do?
Mehr zum Lesen

Wie man die Trinity-Studie umsetzen in 2026
Wende die 4%-Regel an. Praktische Schritte, um die Ergebnisse der Trinity-Studie in Ihrem eigenen Ruhestandsplan umzusetzen und sicher Geld abzuheben.
Equity Glidepaths im Ruhestand
Reduzieren Sie das Sequenzrisiko. Erfahren Sie, wie ein Equity Glidepath (Erhöhung der Aktienquote nach dem Renteneintritt) die Überlebensrate Ihres Portfolios verbessern kann.
5 großartige Wege zur finanziellen Unabhängigkeit
Finanzielle Unabhängigkeit (FI) ist ein großartiger Zustand, in dem Sie nicht von Ihrem Einkommen abhängig sind, um zu leben. Hier sind ein paar Möglichkeiten!
Erfahren Sie, wie Sie Ihre Finanzen ganz einfach optimieren und in der Schweiz Tausende sparen können, mit unserem exklusiven E-Book. Entdecken Sie die kostengünstigsten Finanzdienstleistungen, maßgeschneidert für clevere Einwohner und Expats!
Ihren KOSTENLOSEN Schweizer Sparratgeber