Does the 4 percent rule work in recent years?
| Updated: |
(Disclosure: Some of the links below may be affiliate links)
Typically, when we do retirement simulations, we want to take as many years back as possible. For my previous Retirement simulations, this meant using about 150 years of data to do the simulation.
However, there is potentially an issue with that simulation. What if we are not in the same situation now anymore? What if the chances of success in recent years significantly differ from before?
I thought it would be an interesting analysis to focus on the last 50 years instead of taking the full 150 years of data. For instance, this would mean no Great Depression in the analysis.
So, we will see if the 4 percent rule would have worked in the last 50 years. And, of course, we test many more withdrawal rates!
Is it different?
First, we will compare these two periods:
- 1871 – 2024: 150+ years of data
- 1968 – 2018: 50 years of data
Are they different? Many different events appeared in both periods. But we are interested in the stock market results and the inflation results. These facts could make a big difference if you rely on the 4 percent rule for your retirement. They will make a difference regardless of your withdrawal rate.
Returns on stocks
First, we will look at stocks.
In the last 150 years, the average monthly stock returns have been 0.82%. In the previous 50 years, the average monthly returns have been 0.88%. It means that average returns have been going up these last 50 years. We can probably explain this because we are at the top of a strong bull market.
In the last 150 years, there have been 690 negative months. It is 38.85% of the months. In the previous 50 years, there have only been 232, a slightly lower 37.90%.
In the last 150 years, the best stock month was April 1933, with +42.89% returns! In comparison, the best month in the last 50 years was October 1974, with only +16.77%. The peaks are much lower during the previous five decades.
The worst month for stocks in the last 150 years was September 1931, with -29.62%! In the last 50 years, it was October 1987 with -21.53%! Again, the peaks are lower in the last years.
It is interesting that in the last 50 years, the returns of the lowest month had an absolute value higher than the best month.
Overall, stocks have returned slightly more these last 50 years and have been less volatile.
Returns on bonds
We can do the same analysis on bonds as well.
In the last 150 years, bonds returned an average of 0.39% monthly. But in the last five decades, they returned an average of 0.62%. The average returns on bonds have been significantly higher these last 50 years! I am surprised. I thought bond returns had been going down. But this is not the case.
In the last 150 years, there have been 594 negative months for bonds (33.44%). And in the last 50 years, there were 232, which means 37.90%. We can see that bonds have been significantly more volatile these last decades.
In both periods, the best month for bonds was April 1980, with returns of 12.688%. It is a very high return for bonds over a single month! Almost as high as the best returns for stocks in the last 50 years (16.77%).
Again, in both periods, the worst month was February 1980, with a return of -7.91%! Still, this is significantly more than I thought.
So bond returns have been getting higher. However, they have also been getting more volatile with more negative months.
Inflation
Finally, we can also look at the inflation data.
On average, monthly inflation has been 0.17% in the last 150 years. In the last five decades, monthly inflation has been 0.32%. It has been higher recently!
The month with the highest inflation in the last 150 years was October 1902, with 6.96%! It is insanely high inflation for a month. In a single month, the cost of living went up by almost 7%! In the last 50 years, the worst month was August 1973, with 1.80% inflation.
The month with the lowest inflation in the last 150 years was June 1898, with -6.50%. Again, this is a crazy number! In the last 50 years, the lowest inflation in a month was in November 2008.
In the last 150 years, there were 379 months with negative inflation. It means that one month out of five, prices went down. But in the last 50 years, only 47 months were negative. It is only 7.67%.
So, inflation has been higher these last five decades.
Is it different?
When we consider everything, things are not entirely different between these two periods. But there are still some significant differences.
First of all, the main difference is inflation. On average, monthly inflation has been almost twice higher during these last 50 years than in the last 150 years. It is important because higher inflation makes it harder to retire early.
On the other hand, bonds and stocks have had higher returns. These returns compensate for the higher inflation. On the other hand, they have also both been more volatile. In both cases, there have been more negative months in the last 50 than in the last 150 years.
But what is also very interesting is that the magnitude of the worst and best months is also lower. The absolute values are lower. It is important because months with -20% can be extremely detrimental to your retirement. It is especially true if you withdraw money every month.
Now that we know the differences between these periods, it is time to run some withdrawal rate simulations!
The simulation
For doing these 4 percent rule simulations, I am using United States Stocks, Bonds, and Inflation data from 1968 to 2018. It is the same data I have been using for several of my simulations. For instance, I have used them to refresh the results of the Trinity Study.
If you want more details, I detail the data in my post about my FIRE calculator based on my tool and data. The source code is also available!
For this particular simulation, I used different portfolios and different withdrawal rates. In all simulations, I use a yearly rebalancing. If you wonder why, look at simulations of rebalancing in retirement.
The Results
I do the simulation for different numbers of years in retirement. I will start at 20 and end at 40 years of retirement. Ideally, we would want to simulate with more years. But we only have 50 years of data. Simulating for more than 40 years would not yield results with any statistical quality.
Retirement of 20 years
Here are our chances of success in sustaining our portfolio for 20 years in the last 50 years.
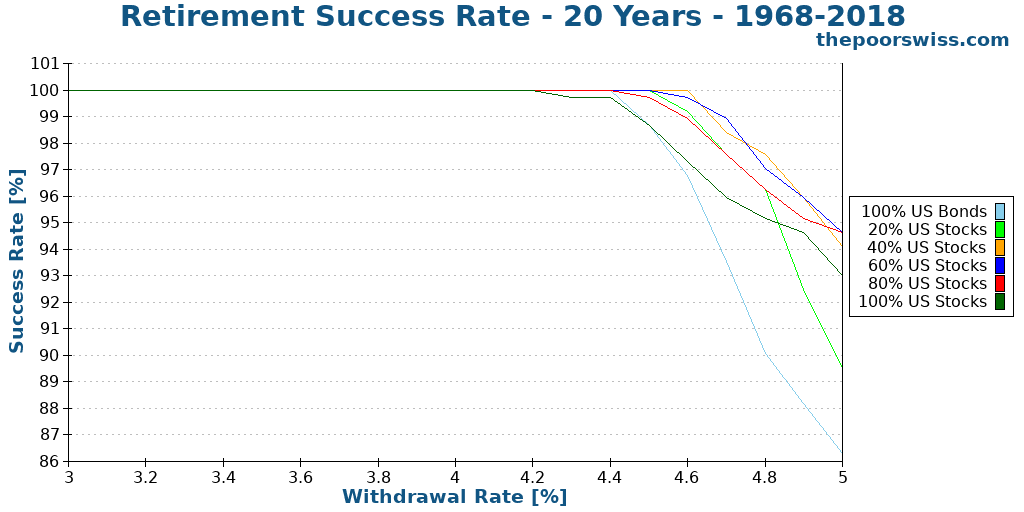
As you can see, the chances of success of such a retirement are high. Even with a 4.5% withdrawal, we would have chances of success that are higher than 99%! With a 5% withdrawal rate and a decent amount of stocks, chances of success are still higher than 95%!
The 4 percent rule never failed in the last 50 years for 20 years of retirement. It is really impressive!
But how does it compare with classic results? Here are the results with the entire period of data.
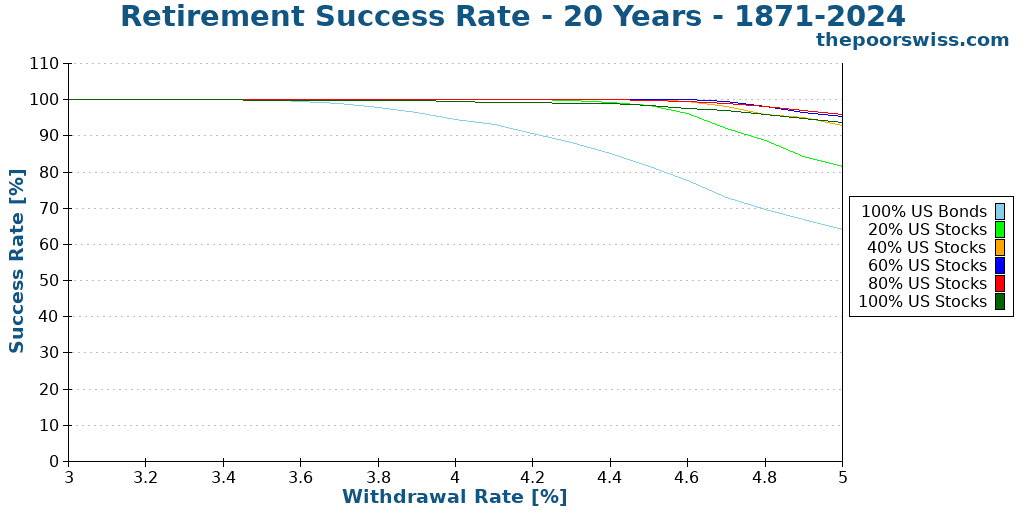
We can directly see that the two graphs are very different! I did not expect so much difference when I started this experiment.
We can see that for all the portfolios, the success rates have been significantly higher these last 50 years. It is especially true for bonds. Bonds in a portfolio have performed much better in the last 50 years than in the last 150 years.
Now, 20 years of retirement is a very short period. Most people will need to sustain their expenses for a significantly longer period. So, we will try to see what happens for a longer retirement in more detail.
Retirement of 30 years
Here are our chances of success for a 30 years retirement in the last 50 years.
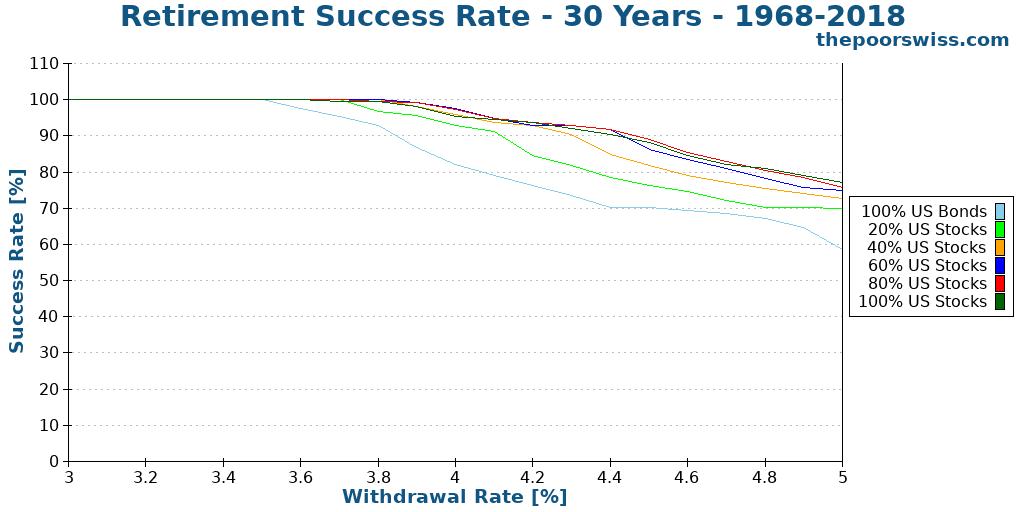
As we expected, the chances of success are much lower for 30 years than for 20 years. But all our portfolios are still doing a very good job when using the 4 percent rule. These are some very strong success rates!
Even for a higher withdrawal rate, such as 4.5%, the chances of success of portfolios with high stock allocation have about a 90% chance of success. It is a great result.
Even with only 20% of stocks, you would still be likely to succeed with a 4% withdrawal rate.
We can put things in perspective with the results of the entire period.

The differences between the two graphs are very important! The impact on stocks is not very significant. But the effect on bonds is extremely significant.
In the last 150 years, the 4 percent rule would have failed with a portfolio with 20% or fewer stocks. But in the last 50 years, this is entirely possible. It shows that bond returns were exceptional in the last five decades. This situation was not the norm before.
But even with 40% of stocks, you would still have had more than 90% chances of success with the 4 percent rule. But people using high allocations to bonds are very conservative. They would probably aim at more than 95% and would need a 3.5% withdrawal rate in that.
We can also observe another interesting fact. With high withdrawal rates, portfolios with a lot of stocks have done slightly better in the last 50 years than they have in the last 150 years. It is not a huge difference, but still significant. If you plan on a large withdrawal rate, this is something you may want to consider.
A 30 years retirement is already a great test for retirement. But we can see what happens when we do the test for 40 years of retirement.
Retirement of 40 years
First, I need to emphasize that 40 years of simulation over 50 years is not that relevant. It means there are only ten possible starting years for the simulation. And most of the ending years will end up in a strong bull market. The 30 years simulation has much more value. But we can still see what will happen with 40 years periods.
Here are the results for a 40 years retirement:
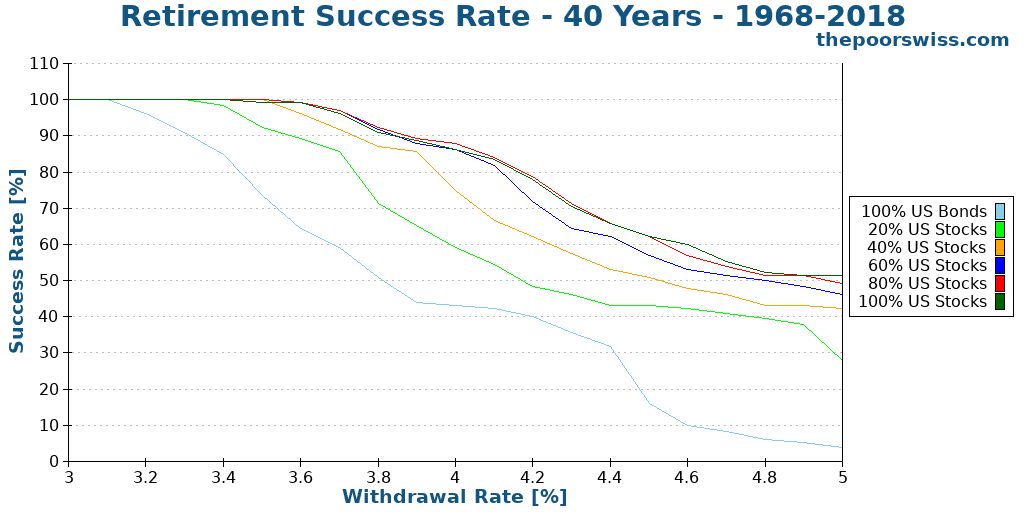
The first thing we can see is that 40 years is when high withdrawal rates stop working. The highest chance of success for a 4.5% withdrawal rate is about 67%. This is where a withdrawal rate between 3.5% and 4% is best. I would say this range is the sweet spot for most people.
With the 4 percent rule, to have a decent (higher than 80%) chance of success, you will need at least 60% of stocks to sustain your lifestyle. Forty years is also when you need more stocks. If you want more bonds, you will need to get a lower withdrawal rate.
Now, we compare the results over the entire period:
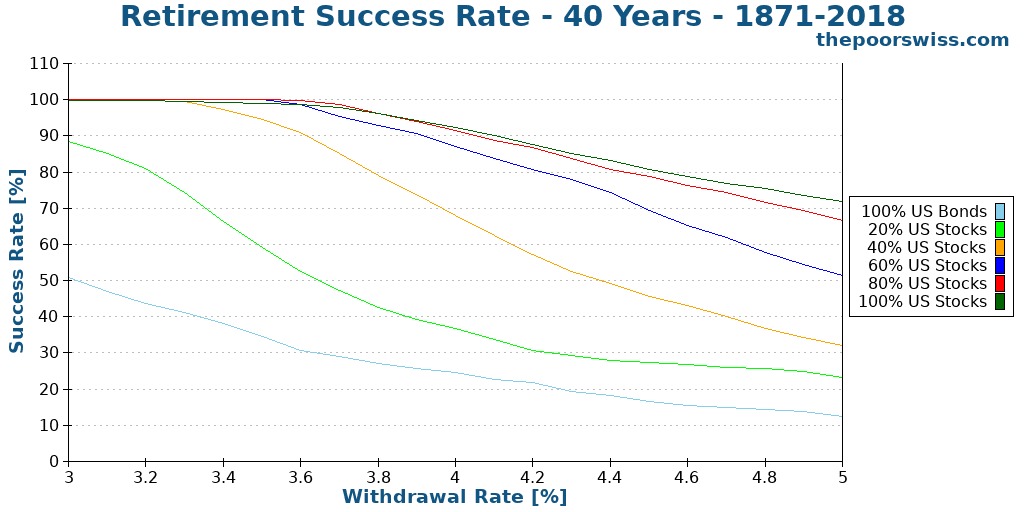
We can observe two main things here.
First, the performance with 40% of bonds and more is worse than in the last 50 years. It makes sense since the returns of the bonds have been much higher recently. Even with the 4 percent rule, you need at least 60% in stocks to sustain your expenses.
Second, the performance with a high allocation of stocks is significantly better than in the last five decades. This point can be explained mostly by higher inflation in the last 50 years. It can also probably be explained by a bad start between 1968 and 1978.
In the last 150 years, you would need at least 60% of stocks to use the 4 percent rule. It is an important fact to know! The 4 percent rule does not work for every portfolio! It is why several people call it the 4 percent rule of thumb.
Given that we only have 50 years of data, it does not make sense to do a simulation for more than 40 years. It is the most significant caveat for reducing the period of simulation.
Summary of the results
We can extract several interesting findings from these results.
On average, the chances of success in retirement are higher in the last five decades than in the last fifteen. It is especially true for portfolios with large allocations to bonds.
On the other hand, for a very long retirement, the chances of success of portfolios with significant allocations to stocks have been slightly lower.
Regarding the 4 percent rule, it has been working very well in the last 50 years. Even for a long retirement, a 4% withdrawal rate would have been adequate. The only time when the rule fails is when you have less than 40% of stocks. If you plan on having 60% or more bonds in your portfolio, you should probably opt for a 3.75% withdrawal rate.
For most portfolios, the safe zone is between 3.5% and 4% withdrawal rates. I do not think it makes sense to go lower than 3.5%. You will end up with a substantial amount of money when you die. And you will need to accumulate too much money to become Financially Independent.
Conclusion
To answer the question from this article: The 4 percent rule has worked really well in the last 50 years!
The last 50 years are significantly different than the last 150 years period. Inflation has been significantly higher. Also, bond returns have been higher. It makes sense since these two are correlated. Moreover, returns have been less volatile.
Once we simulate, we can see several differences between these two periods. In the last 50 years, portfolios with many bonds have performed much better. On the other hand, portfolios with a very large allocation of stocks have performed slightly worse. Overall, if you have bonds in your portfolio, the chances of success are better in the last 50 years than in the last 150 years.
Now, we have to keep in mind that 50 years is a relatively short period. Simulations are getting better with the more data they have. Moreover, this does not allow us to simulate the retirement of more than 40 years. It is essential to realize this. It is the main reason why people simulate the entire period.
Finally, these are only simulations! Nothing tells us that the next 50 years will resemble the last 50 years. Maybe it will. Perhaps it will not. There is no way to know. It could change drastically. But this is still very valuable information.
Seeing these results, I am even more convinced that the 4 percent rule is strong! Moreover, this still reinforces my feeling that withdrawal rates below 3.5% are too conservative.
Finally, if you wonder why I am keeping the 1968 to 2018 period even in 2025, it is because it starts with an interesting bear market. If I use the period 1974 to 2024, the success rates are simply too high.
Before, I was planning on a 3.5% withdrawal rate. Now, I think that I will aim for 3.75% instead. It would mean I have to save 114’000 CHF less than I planned. I will reconsider this, of course. But I think this is a sound withdrawal rate with a substantial stock allocation.
If you want more simulations, I recently simulated retirement scenarios in a low-yield environment.
What do you think of this? Do you think it is harder to retire in the last 50 years? Do you think the 4 percent rule will still work?
More reading

Out of The Rat Race – Financial Freedom – Book Review
Out of The Rat Race is a good book by Eric Duneau that tells how to achieve Financial Freedom by leveraging Real Estate properties, with low savings rate.
Add some margin of safety to your FIRE plan
A good FIRE plan relies on historical data, so we need to protect it with some margin of safety! Here are some ways to achieve extra safety!
Financial Freedom – Book Review
Financial Freedom relates the story of how Grant Sabatier reached Financial Independence in 5 years. Find out what I thought of this book.
Learn easy ways to optimize your finances and save thousands in Switzerland with our exclusive e-book. Learn about the most cost-effective financial services tailored for savvy residents and expats!
Get Your FREE Swiss Money-Saving Guide
Hi Baptiste,
The 4pc rule allows you to increase your withdrawals based on inflation. For a Swiss based investor with ETFs in Sp500, which inflation rate should be taken …the US or the CH one? I would have though the US one given that the investment is in USD, however I guess currency fluctuation needs to be considered with CHF always strengthening so perhaps the CHF inflation rate might be better to compensate for the currency depreciation. Thanks
Hi Max
Inflation is related to your expenses. If you are in Switzerland, you should use CH inflation. This is an advantage for us indeed.
On the other hand, as you pointed out, we have the disadvantage of losing out on the currency depreciation. As Swiss investors, we should expect lower returns than an US investor.
I see you covered Sequence of Returns Risk in the comments, but I think it should figure prominently in any discussion about safe withdrawal rates b/c it can greatly impact success rates. FinancialMentor.com does great work explaining sequence of returns risk. For our part, we are early retirees (late 40’s) so we do not want to draw down anywhere close to 4% of our portfolio b/c we’ll have a long time in retirement (hopefully more than 50 years!). Because we have interests that we can make money from (as consultants) we are cobbling together retirement from consulting work and real estate (which provides a less volatile stream of income and doesn’t have the sequence of returns problem), and we’re only relying on paper assets as a backstop. We’re just into year 2, so ask me how I feel after next big market correction!
Hi Caroline,
I agree that sequences of returns risk are very important. But this post is more of a small simulation than a post about that. I have already mentioned sequences of returns risk in several of my posts. I do not want to discuss them in all of them :)
Good luck with your retirement!
Hi Mr. The Poor Swiss,
Thank you for another very informative post about the 4% rule (of thumb).
I know that the quantity of data is very important for trustful results. I did some simulations myself using an Excel after reading an article about who would have retired in the year 2000 would have a reduced portfolio by now even with the strong bull market (https://www.mymoneyblog.com/portfolio-accumulation-vs-withdrawal-years.html).
This is a scenario where the crises that started in the beginning of 2000’s and in 2008 with a WR of 4% killed the capability of portfolio regeneration even with the bull market. The small data quantity off course affects the reliability of the results but shows that the moment when you retire (early or not) should really be considered if you want a portfolio that can endure and last for all your retirement.
Regards,
Luis Sismeiro
Hi Luis,
Yes, 2000 is indeed a very bad time to start! And so is just before any bear market. I have talked about this in detail as well: Sequence of Returns Risks.
This is a very important thing. Many people do not realize that depending on when they start can change a lot their chances of success.
I can observe the same thing in my simulations.
Thanks for stopping by!
Very interesting, thanks for your work!
I‘m not so sure though that you should count on these results as a swiss investor. A simulation based on a swiss fire portfolio (e.g. 60% msci world, 20% spi, 20% chf bonds) would be even more relevant for swiss investors! Before increasing the WR over 3.5% I would want to know if such a localized simulation would deliver similar results.
Hi Mark,
Thanks!
I completely agree that using a portfolio with the Swiss part would be better. I really want to do it, but the data is really difficult to find. For now, I only found SMI data up to 1988. This is not enough to do any proper simulation. And I do not want to extrapolate this kind of data.
But once I find enough data about Switzerland, I will definitely do this simulation.
Thanks for stopping by!
Thank you for this simulation and all the work you’ve put into it. I’ve done my fair share of calculations and came out with the same conclusion. The 4% rule is valid in most situations. Personally, I do believe I won’t be spending that much being retired and speaking about Switzerland specifically, if I do have health issues having a safety net of 2500 CHF per year to cover the initial costs will make it less scary.
By the time I get to FI I’ll be so used to managing my expenses that I do not fear having to use 4% of a bear market if this happens to be in that time span.
What I haven’t figured out yet is would it be a good strategy withdrawing (= sell stocks) at a higher percentage (let’s say 5%) in a bull market year in order to withdraw a lower percentage (maybe 3%) in a bear market year ? Maybe it’s just as simple sticking to a 4% rule no matter the market situation and deal with it? What do you think?
Hi John,
You are welcome!
It seems indeed that the 4% rule is quite solid! This is a good thing even if this is not surprising.
I would say that even in early retirement, an emergency fund is quite important. I would say it’s even more important.
I would actually stick to 4% all the time. But keep in mind that the 4% is based on your initial portfolio, not on your current portfolio.
It will probably work to withdraw a little more when you have good returns. And ideally, you want to withdraw a little less when the market goes down. But it is not really easy to be flexible.
Thanks for stopping by!
Oh, thank you for mentioning that the 4% rule applies to the initial portfolio, I imagined it applied to the current Portfolio whatever the state of the market is. That makes it easier to calculate indeed.