What is a failsafe withdrawal rate?
| Updated: |
(Disclosure: Some of the links below may be affiliate links)
We have already talked a lot about withdrawal rates and safe withdrawal rates in the context of retirement. However, we have not yet talked about failsafe withdrawal rates.
Simply put, a failsafe withdrawal rate is a withdrawal rate that would never have failed in the past. In this article, we see what withdrawal rates are failsafe and if there is more to it than this simple definition.
Failsafe Withdrawal Rate
Again, we start with the definition: a failsafe withdrawal rate is a withdrawal rate that would never have failed in the past. Put another way, if you used a failsafe withdrawal rate, you would not have run out of money in retirement for a given period and portfolio.
It is essential to consider that there is a failsafe withdrawal rate for each period and portfolio. It means there is no single failsafe withdrawal rate, but there is one for each situation.
If you have historical data and some coding skills, as I do, it is easy to find failsafe withdrawal rates for many situations. The task is simply to try many withdrawal rates, from high to low, until you find one that yields a 100% success rate.
So, we will see the failsafe withdrawal rates for some standard portfolios and retirement periods. I will use US stocks and bonds, with historical data from 1871 to 2021.
If you want more information on this data, you should look at how I reproduced the results of the Trinity Study.
30 Years Retirement
We start with a retirement period of 30 years. Here are the failsafe withdrawal rates for different portfolios.

The highest failsafe withdrawal rate is obtained with 70% stocks and 30% bonds. Before and after this, the failsafe withdrawal rates are lower.
These results are pretty interesting. They come down to two points:
- Stocks are necessary to have enough returns to last 30 years.
- Bonds improve the likelihood that a portfolio will last longer (worst duration) but do not always improve the success rate of a portfolio.
Does that mean we should only use the failsafe withdrawal rate? Not necessarily. A 100% success rate is good, but it may not be necessary. Some people want to aim lower to be more aggressive.
You do not want to fail in retirement. But in some cases, you could plan a higher withdrawal rate with some flexibility, and you could retire without issues.
So, we can see a few variant withdrawal rates by allowing some failure.
| Portfolio | Failsafe | 1% | 5% | 10% | 25% |
|---|---|---|---|---|---|
| 100% US Bonds | 2.33 | 2.42 | 2.64 | 2.90 | 3.25 |
| 10% US Stocks | 2.99 | 3.13 | 3.35 | 3.49 | 3.74 |
| 20% US Stocks | 3.18 | 3.34 | 3.55 | 3.70 | 4.08 |
| 30% US Stocks | 3.35 | 3.50 | 3.70 | 3.87 | 4.29 |
| 40% US Stocks | 3.51 | 3.63 | 3.79 | 4.01 | 4.51 |
| 50% US Stocks | 3.64 | 3.70 | 3.89 | 4.15 | 4.72 |
| 60% US Stocks | 3.69 | 3.79 | 3.99 | 4.26 | 4.90 |
| 70% US Stocks | 3.73 | 3.84 | 4.08 | 4.33 | 5.05 |
| 80% US Stocks | 3.56 | 3.86 | 4.11 | 4.41 | 5.22 |
| 90% US Stocks | 3.23 | 3.84 | 4.17 | 4.49 | 5.37 |
| 100% US Stocks | 2.84 | 3.70 | 4.21 | 4.54 | 5.47 |
For instance, the 5% column means looking for a withdrawal rate with at least a 95% success rate.
These results are very interesting. Indeed, tolerating some failures means that the withdrawal rates you can use go up significantly. This result is especially true for stocks. When we accept 5% failure, we can see that the portfolio with 100% allows the highest withdrawal rate.
The level of failure you will tolerate in your case will depend only on you. Each person should choose the appropriate level of acceptable failure. For me, it is between 5% and 10%.
40 Years Retirement
Thirty years of retirement is relatively short if you plan to retire early. So, we look at the failsafe withdrawal rates for 40 years of retirement.
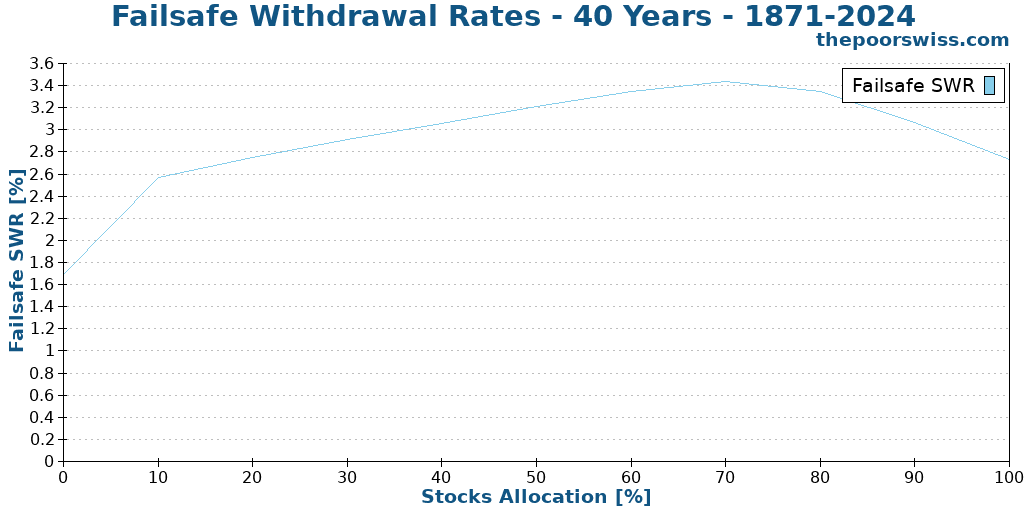
Over 40 years, the failsafe withdrawal rates are all lower than they were for 30 years. Interestingly, the failsafe withdrawal rates for bonds have fallen more than for stocks. This finding makes sense because bonds have lower returns, and a long retirement period needs stocks. But once again, the highest failsafe withdrawal rate is attained with 70% stocks.
Here are again at the different withdrawal rates.
| Portfolio | Failsafe | 1% | 5% | 10% | 25% |
|---|---|---|---|---|---|
| 100% US Bonds | 1.69 | 1.75 | 1.88 | 2.15 | 2.62 |
| 10% US Stocks | 2.57 | 2.68 | 2.83 | 2.94 | 3.16 |
| 20% US Stocks | 2.75 | 2.90 | 3.11 | 3.24 | 3.51 |
| 30% US Stocks | 2.91 | 3.07 | 3.29 | 3.42 | 3.77 |
| 40% US Stocks | 3.06 | 3.21 | 3.44 | 3.57 | 3.97 |
| 50% US Stocks | 3.21 | 3.34 | 3.52 | 3.69 | 4.18 |
| 60% US Stocks | 3.35 | 3.45 | 3.61 | 3.81 | 4.34 |
| 70% US Stocks | 3.44 | 3.54 | 3.70 | 3.90 | 4.51 |
| 80% US Stocks | 3.35 | 3.60 | 3.77 | 3.97 | 4.65 |
| 90% US Stocks | 3.07 | 3.61 | 3.83 | 4.04 | 4.78 |
| 100% US Stocks | 2.73 | 3.52 | 3.89 | 4.12 | 4.89 |
Now, even with a 5% failure rate, the 4% rule will always fail. We would need to allow 10% failure to have a 4% withdrawal rate.
Nevertheless, it is still interesting that withdrawal rates are still relatively high, with a reasonable stock allocation and a certain tolerance to failure.
50 Years Retirement
Here is what happens for a retirement of 50 years.

As expected, failsafe withdrawal rates go even lower. Even with 70% stocks, we are barely at 3%.
| Portfolio | Failsafe | 1% | 5% | 10% | 25% |
|---|---|---|---|---|---|
| 100% US Bonds | 1.37 | 1.42 | 1.58 | 1.64 | 2.20 |
| 10% US Stocks | 2.27 | 2.37 | 2.49 | 2.57 | 2.87 |
| 20% US Stocks | 2.46 | 2.61 | 2.81 | 2.96 | 3.21 |
| 30% US Stocks | 2.64 | 2.79 | 3.04 | 3.17 | 3.50 |
| 40% US Stocks | 2.80 | 2.96 | 3.19 | 3.32 | 3.71 |
| 50% US Stocks | 2.95 | 3.10 | 3.31 | 3.46 | 3.91 |
| 60% US Stocks | 3.09 | 3.24 | 3.40 | 3.59 | 4.08 |
| 70% US Stocks | 3.23 | 3.34 | 3.48 | 3.70 | 4.23 |
| 80% US Stocks | 3.19 | 3.41 | 3.57 | 3.78 | 4.35 |
| 90% US Stocks | 2.94 | 3.46 | 3.63 | 3.84 | 4.46 |
| 100% US Stocks | 2.63 | 3.35 | 3.69 | 3.93 | 4.59 |
We can see that even when tolerating a 10% failure rate, we do not reach a 4% safe withdrawal rate. Again, the more failures you are willing to accept, the better stocks perform.
60 Years Retirement
Finally, here is what happens with 60 years of retirement.
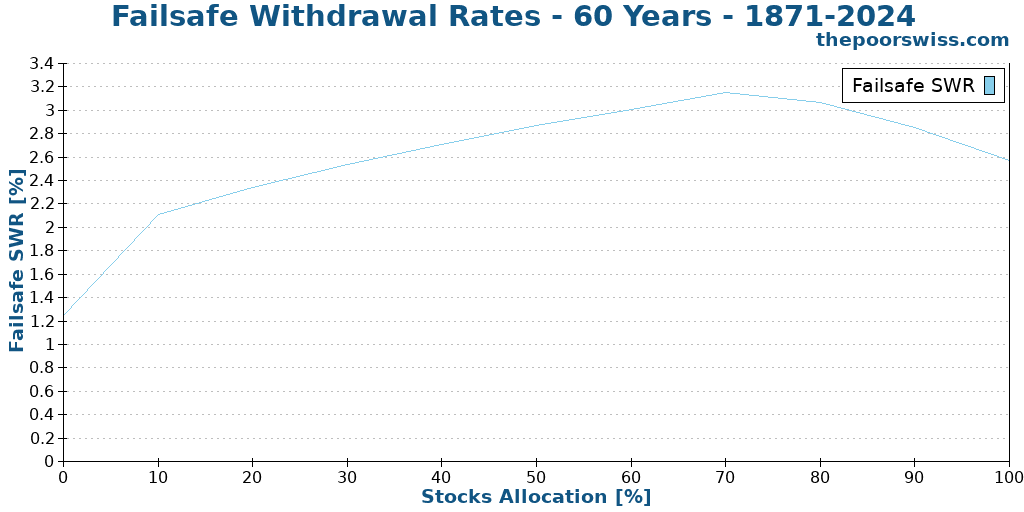
The failsafe withdrawal rates are lower again, but the difference is not very large. Indeed, a strategy that would work over 50 years would generally work over 60 years.
And here are the details:
| Portfolio | Failsafe | 1% | 5% | 10% | 25% |
|---|---|---|---|---|---|
| 100% US Bonds | 1.25 | 1.29 | 1.42 | 1.48 | 1.90 |
| 10% US Stocks | 2.11 | 2.22 | 2.32 | 2.42 | 2.68 |
| 20% US Stocks | 2.34 | 2.48 | 2.66 | 2.82 | 3.08 |
| 30% US Stocks | 2.54 | 2.69 | 2.92 | 3.09 | 3.39 |
| 40% US Stocks | 2.71 | 2.87 | 3.11 | 3.29 | 3.65 |
| 50% US Stocks | 2.87 | 3.04 | 3.27 | 3.45 | 3.87 |
| 60% US Stocks | 3.01 | 3.16 | 3.43 | 3.60 | 4.09 |
| 70% US Stocks | 3.15 | 3.28 | 3.51 | 3.70 | 4.28 |
| 80% US Stocks | 3.07 | 3.39 | 3.60 | 3.82 | 4.45 |
| 90% US Stocks | 2.85 | 3.41 | 3.69 | 3.93 | 4.62 |
| 100% US Stocks | 2.57 | 3.24 | 3.78 | 4.03 | 4.74 |
If you have followed the results closely, you will see that some of these results are higher than 50 years. Does this mean that 60 years is easier than 50 years? No!
The problem with 60 years is that we are missing some bear markets in history. For instance, we are missing the 1966 and 1968 bear markets that the 50-year periods covered. This result shows the limits of the historical simulation since we only have data until 1871.
Nevertheless, I still think this period is interesting to study. One interesting thing is that this time 1% tolerance is not enough to get 100% stocks at the top.
Our situation
This data is interesting, but how can we use it?
We can take our situation, for instance. I want to be financially free by the time I am 50. At this time, I want my money to last about 50 years. Therefore, I need to look at the table for 50 years:
| Portfolio | Failsafe | 1% | 5% | 10% | 25% |
|---|---|---|---|---|---|
| 100% US Bonds | 1.37 | 1.42 | 1.58 | 1.64 | 2.20 |
| 10% US Stocks | 2.27 | 2.37 | 2.49 | 2.57 | 2.87 |
| 20% US Stocks | 2.46 | 2.61 | 2.81 | 2.96 | 3.21 |
| 30% US Stocks | 2.64 | 2.79 | 3.04 | 3.17 | 3.50 |
| 40% US Stocks | 2.80 | 2.96 | 3.19 | 3.32 | 3.71 |
| 50% US Stocks | 2.95 | 3.10 | 3.31 | 3.46 | 3.91 |
| 60% US Stocks | 3.09 | 3.24 | 3.40 | 3.59 | 4.08 |
| 70% US Stocks | 3.23 | 3.34 | 3.48 | 3.70 | 4.23 |
| 80% US Stocks | 3.19 | 3.41 | 3.57 | 3.78 | 4.35 |
| 90% US Stocks | 2.94 | 3.46 | 3.63 | 3.84 | 4.46 |
| 100% US Stocks | 2.63 | 3.35 | 3.69 | 3.93 | 4.59 |
In retirement, I plan to have either 100% stocks or 80% stocks. My risk tolerance is between 5% and 10%. So, I can take the middle value between these two numbers, for instance.
For my two portfolios:
- With 80% stocks, I would need a withdrawal rate between 3.57% and 3.78%
- With 100% stocks, I would need a withdrawal rate between 3.69% and 3.93%
Currently, my target withdrawal rate is 3.75%. Seeing these results, I will increase my withdrawal rate to 3.80%. It is a tiny difference. I am still 15 years from retirement, so I may change my withdrawal rate several times before reaching my goal.
Conclusion
A failsafe withdrawal rate is a withdrawal rate that would not have failed in the past for a given portfolio and retirement period. It is an interesting concept that can help some people choose their withdrawal rate.
I do not think people should only pick a failsafe withdrawal rate. It is often too conservative. However, some people prefer to use that information. So, it is essential to know this concept.
Using this data, I will change my withdrawal rate from 3.75% to 3.80%, more in sync with my risk profile.
If you want additional information, you should choose how to choose your safe withdrawal rate. And an interesting read would also be to read about dynamic withdrawal rates.
What do you think about this? What is your target withdrawal rate?
More reading

Why do so many software engineers choose FIRE?
Tech and FIRE. Explore why so many programmers and software engineers are drawn to the Financial Independence, Retire Early movement.
6 keys to avoid the pitfalls of financial independence
The dark side of FIRE. We discuss the potential pitfalls of pursuing Financial Independence, from burnout to social isolation, and how to avoid them.
Can flexibility help your early retirement?
Can you withdraw more money from your portfolio if you have flexibility with your expenses in retirement? We find out with many simulations.
Learn easy ways to optimize your finances and save thousands in Switzerland with our exclusive e-book. Learn about the most cost-effective financial services tailored for savvy residents and expats!
Get Your FREE Swiss Money-Saving Guide
Just discovered you – thank you!
Older retiree here, in California, with 10-20 year horizon. Do you have any analysis for that period?
Hi Av,
You are welcome.
I have not done analysis for shorter periods yet. You should be able to use our FIRE calculator to find out more or less which is safe for you. But for “short” period, 4% is generally quite safe.
Great article as always – thanks for doing these. One question came to my mind – the failsafe rate for 30 years in your simulation above is 2.67% for a 100% stocks portfolio. However, in the Trinity Study (and your updated Trinity Study with data from 1871 to 2023), the success rate for a 100% stocks portfolio and a withdrawal rate of 3.5% over 30 years seems to be 100%. Which one is failsafe – 2.67% or 3.5%?
thanks!
Hi Ujiwal
The original trinity study never reported any failsafe withdrawal rate.
In my updated results, the result is close to 100% but not exactly. At 3.5%, we get 99.19% success rate. So, the failsafe is 2.67%.
Great article, for me as one on the stressed side of the spectrum (though I’m 100% stocks), the failsafe is a great way to feel confident to increase my spending.
So if the failsafe WR for 60 years is 2.67%, does it mean (statistically) that whenever the net worth is increasing, one can always increase his spending to 2.67% of his current net worth (and never decrease)?
Meaning – “2.67% * (all time high)”
Hi dalig,
No, you cannot do that. It’s 2.67% of your initial portfolio, not of your current portfolio. If you want to do something dynamic, I have another article about that: Should you use a dynamic withdrawal rate?
I think you are right and Baptiste is wrong here. You can always assume that the day¹ when stocks hit all-time high was your retirement date (of you’ve retired already, you can always retire again).
(1) Simulations probably use month-end data, so, strictly speaking, you should only look at the highest month end value.
Thank you for this work. For the small failure percentages it would be interesting to see if the individual failures were grouped around certain regimes, such as 30-year retirements starting 1966 and starting 1937. 1966 was an overvalued market with high future inflation and bad economic conditions and I believe we here in the US are in a 1966-1982 economic period today which will negatively affect safe withdrawal rates.
Hi Andrew,
That’s a good point. I should study the periods in which retirement is more likely to fail. This is interesting for both the starting points and the failing points.
I will try to write an article about that in the future.
Very good article as always.
Have you ever thought about doing bootstrapping for these kinds of simulations?
Keep it up!
Hi Johannes,
Are you talking about bootstrapping in statistics? What do you think random sampling would achieve?
Very nice article as usual!
I think it will be interesting to re-run that simulation at end of 2022 to see how such a bad year can impact a 30 or 50 year forecast.
Hi Waldo,
I will update my Trinity Study results next year. I may add some data about the failsafe withdrawal rate in it!
Thanks for the suggestion.
Usually, a single year makes little difference over that large of a dataset.
Using two decimals in withdrawal rate must be humour?😄
In practice, you probably wouldn’t want to plan for 3.23% indeed :)
But if you want to calculate the failsafe withdrawal rate, you still want to be as precise as possible. And then, people can either round up or down based on their needs and wants.
Nice article. I was wondering if/how inflation (we are currently experiencing some difficult times in this area) is taken into account in such calculations over such long time. Would be nice to have some „inflation adjusted“ facts. Thanks
Hi Peter,
US inflation is taken into account in each of these simulations. There were some periods of very high inflation in the past.
Good article but maybe it should also mention something about sequence of return risk – very important when considering safe withdrawal rates.
Hi Tania,
All these simulations are done with historical data, so sequences of returns risk are already factored in.