Should you use a dynamic withdrawal rate?
| Updated: |
(Disclosure: Some of the links below may be affiliate links)
Until now, we have mostly focused our experiments on fixed withdrawal rates. But can we do better with dynamic withdrawal rates? Many dynamic withdrawal rate strategies exist to try to increase spending or minimize risk.
I will simulate some retirement scenarios where the withdrawal are changing over time instead of being fixed. We will see whether these strategies are interesting or not.
Fixed withdrawal rate
First, we can define that is a fixed withdrawal rate.
In most of my simulations so far, I have used the original withdrawal rule. This rule states that we withdraw a constant amount of money each month. This amount of money is only adjusted for inflation and will not vary otherwise. We choose that amount of money based on a percentage (the withdrawal rate) of the initial portfolio.
For instance, if you start retirement with 1’000’000 CHF and have a withdrawal rate of 4%, you will be able to spend 40’000 CHF per year. This amount will be adjusted each month for inflation.
What is important is that you will spend that amount of money regardless of whether the stock market is doing well or not. So, sometimes, this will represent a small portion of your current portfolio, but sometimes a large portion (when markets are doing poorly).
The advantage of this strategy is that you only need to pick a withdrawal rate. With dynamic withdrawal rates strategies, you will need to decide on a few more things.
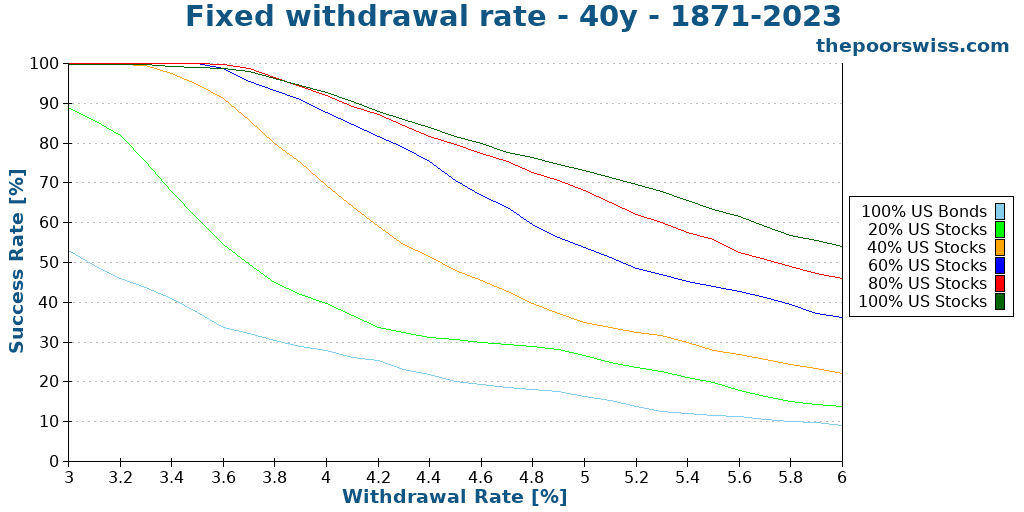
The disadvantage of a fixed withdrawal rate strategy is that it is often too conservative. It means we typically spend less than we could and end up with too much money. For some people, generational wealth is something they want. But for others, it is a waste of money, and they would have preferred to either spend more money or accumulate less money before retiring.
Here are the standard results for 40 years of retirement with US stocks and bonds and with different withdrawal rates.
Simple Dynamic withdrawal rate
In the past, we have already talked about one dynamic withdrawal rate strategy: Current Portfolio Withdrawal Rate.
In this strategy, the withdrawal rate is based on the current portfolio instead of being based on the initial portfolio. So, if you use a 3% withdrawal rate and your portfolio is 1’000’000 CHF, you will withdraw 30’000 CHF. But if your portfolio goes up to 1’500’000 CHF, you will be able to spend 45’000 CHF.
On the other hand, if your portfolio goes down to 500’000 CHF, you will only be able to spend 15’000 CHF. At some point, you may reach a point where you cannot live with such a low amount of money. Therefore, we must introduce a second parameter, a minimum withdrawal. So, if your minimum is 20’000 CHF, you will still withdraw more than 3% in the last example. Again, we should adjust the minimum for inflation every month to be realistic.
In some cases, you may even want to introduce a maximum, which would increase your chances (unless you put it too high). For instance, you could use a 4% dynamic withdrawal rate, but you do not want to reach more than 5% of the initial value.
Again, Here are the standard results for 40 years of retirement with US stocks and bonds and with different withdrawal rates. I have a used a minimum withdrawal of 4% of the initial portfolio. This is a rather high minimum for some people. But it is a reasonable starting point because many people also overestimate their capacity to be flexible.
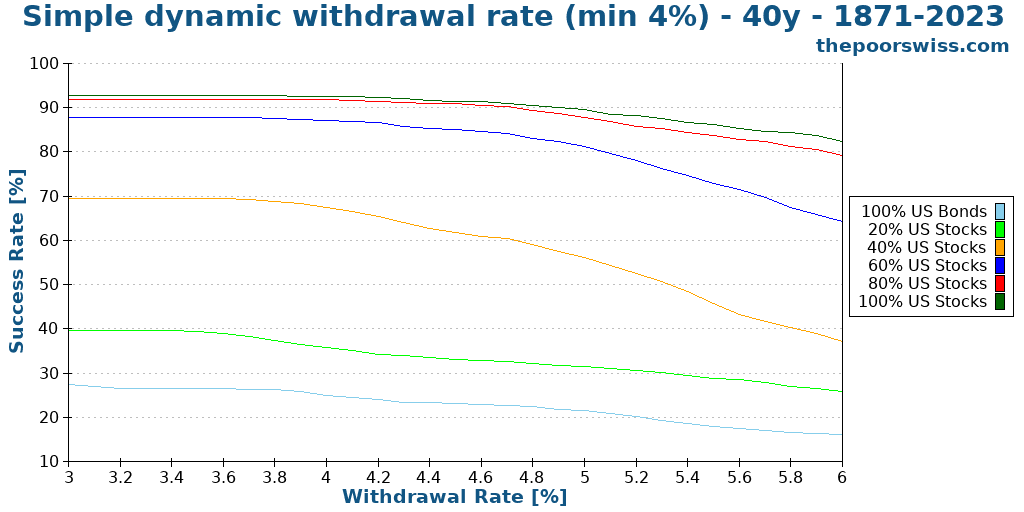
We can observe several interesting facts from this graph. First, the success rates are generally significantly higher for higher withdrawal rates. This is good because it is the goal of this strategy to spend more money in retirement. And the second observation is the plateau at the beginning. This plateau is simply due to using a minimum withdrawal of 4% with some withdrawal rates lower than that. This minimum also explains why at lower withdrawal rates, this strategy appears worse than the fixed withdrawal rates.
Vanguard Dynamic Spending
The strategy that triggered me to write this article and run these simulations was mentioned in a paper by Vanguard. This strategy is quite interesting and builds upon the Simple Dynamic withdrawal rate strategy.
The idea is also that you have a withdrawal rate based on the current portfolio. However, there is a maximum increase and decrease per year. For instance, the original paper uses 5% as the maximum increase each year and 2% maximum decrease from last year. Moreover, we can also add an absolute minimum withdrawal value. And we can also introduce an absolute maximum as well.
For instance, if your portfolio is worth 1’000’000 USD one year, you can spend 50’000 USD. The next year, if your portfolio is worth 1’100’000 USD, you could spend 55’000 USD. However, since this more than 5% higher than the previous year, this is reduced to 52’500 CHF.
This strategy avoids considerable swings in spending, compared to the simple dynamic withdrawal rate strategy. The disadvantage is that there are now many more parameters.
So, we will see how this works with our data.
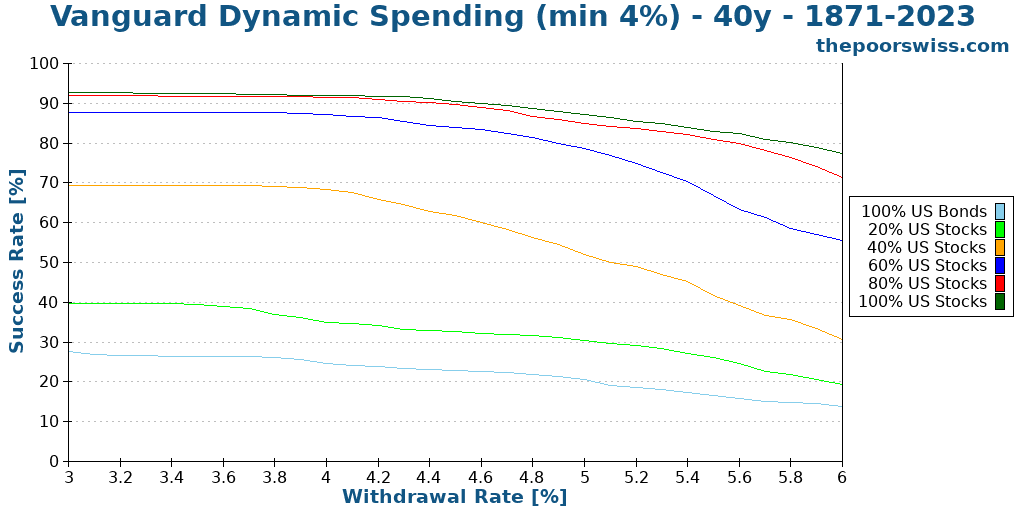
These results are very similar to what we observed on the previous results for the current portfolio withdrawal strategy. We see the same plateau, and we see the same higher results than with the fixed strategy.
We will need more metrics to compare the different strategies in detail.
Fixed or dynamic?
We have now looked at three strategies: one fixed and two dynamic. How do we compare multiple strategies together? For that, we have to look at different metric.
The first metric we will look at is the success rate. For the remainder of this section, I will use the 80/20 portfolio as the example and compare the different strategies on them.
So, here is the success rate for 40 years of retirement with our different strategies and an 80/20 portfolio.
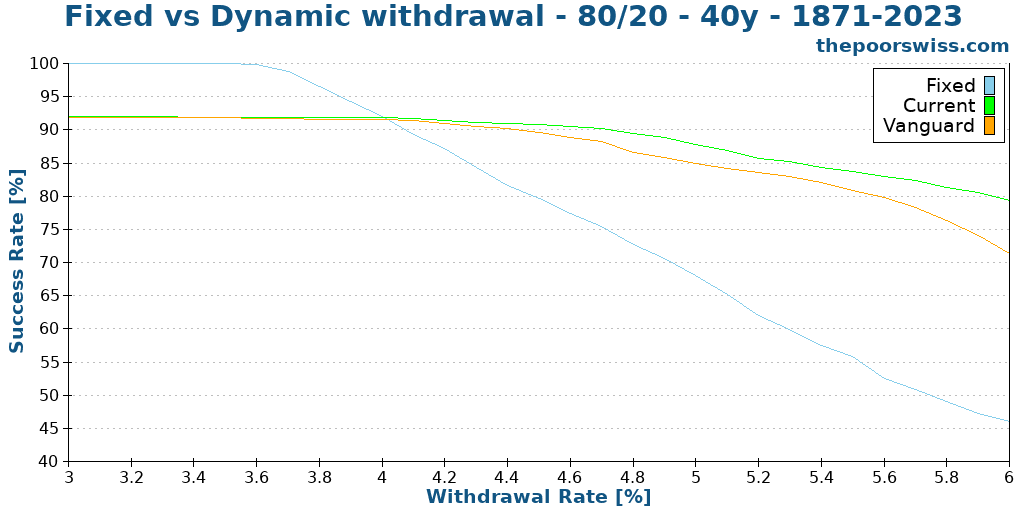
Below 4%, fixed withdrawal rate has an apparent advantage. However, this is only due to the use of 4% as the minimum withdrawal. Above 4%, the dynamic withdrawal strategies have a significant advantage in success rate. And it looks like the simple strategy is better than the Vanguard Dynamic Spending Strategy.
We can show this graph again starting at 4% since below that is not that interesting.

In all cases, the simple strategy has a higher chance of success than the Vanguard Dynamic Spending strategy. As the withdrawal rate increases, so does the gap between the fixed and dynamic withdrawal rate strategies.
What is very fascinating to note that is that both withdrawal rate strategies still have a good success rate, even at a 5% withdrawal rate. This is good because this is the goal of these strategies, where people want to spend more money.
And we can do the same comparison for 50 years of retirement to see if it makes any difference.
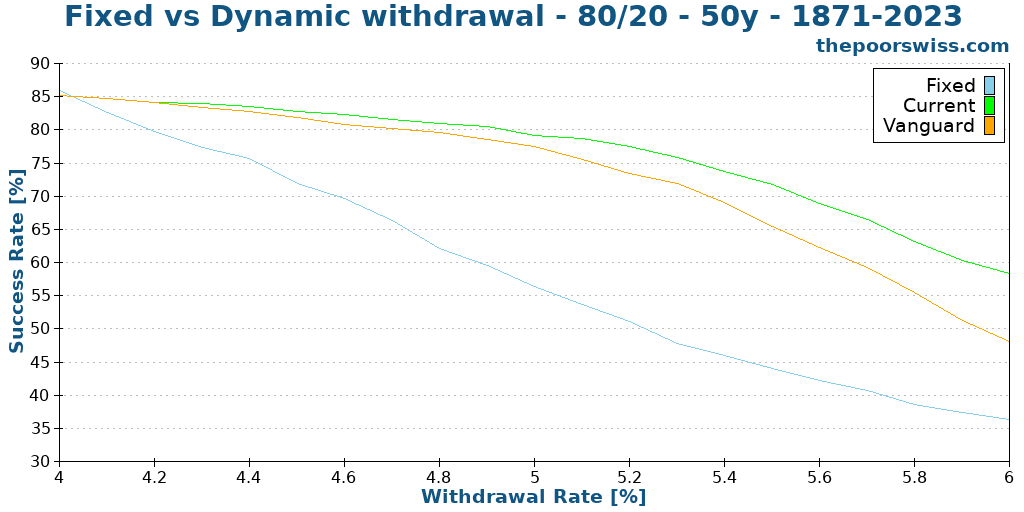
The results are pretty similar to the previous ones. We can see that the gap between the two dynamic withdrawal rate strategies is lower than before. We can also see that the all success rates are lower than before, which makes sense since it is harder to sustain for a longer time.
Considering this, does this mean that dynamic withdrawal rates are strictly better? Not necessarily. We need to look a more metrics to compare these two different strategies.
Worst Duration
The worst duration is an interesting metric because it shows how early a portfolio can fail. I like to look at this metric next to the success rate because you may want a better worst duration at the expense of a slightly lower average success rate.
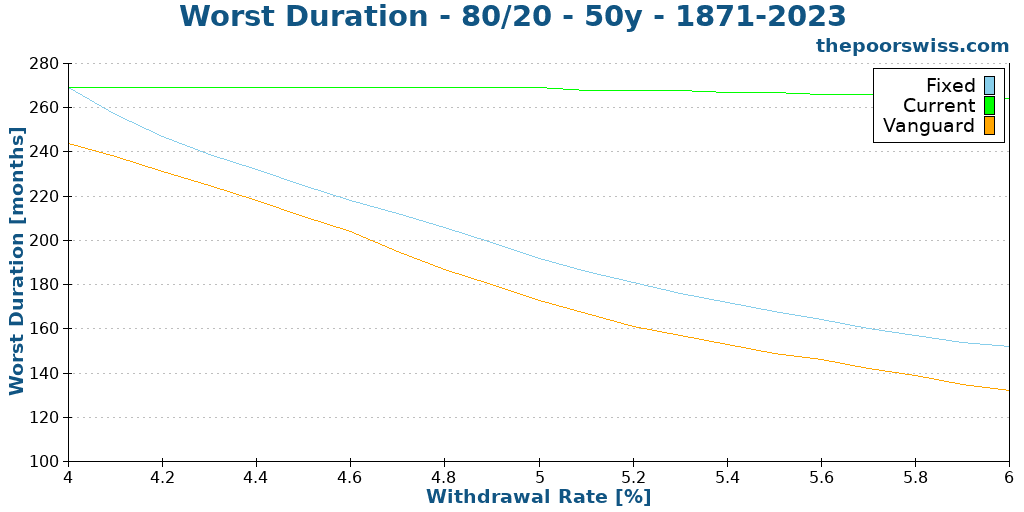
First, we can observe that the current strategy is much better than the fixed strategy. This makes sense because it can spend significantly lower amounts when the portfolio is getting depleted. However, we can also observe that the Vanguard strategy is even worse than the fixed strategy.
This result is quite surprising. At first, I would expect the Vanguard strategy to be almost on par with the current strategy. However, when thinking about it, it actually makes sense. The problem with the Vanguard dynamic spending is that is it adapts slowly to changes. By definition, we want a maximum decrease of 2% from the previous year. So, if your portfolio goes down by 20% in a year, your withdrawal will not go down more than 2%. It means we can have huge effective withdrawal rates with Vanguard dynamic spending. This hurts the worst case a lot while not hurting too much the average because what matters is more the minimum withdrawal.
Terminal values
We can continue our analysis by taking a look at the average terminal values after 40 years.
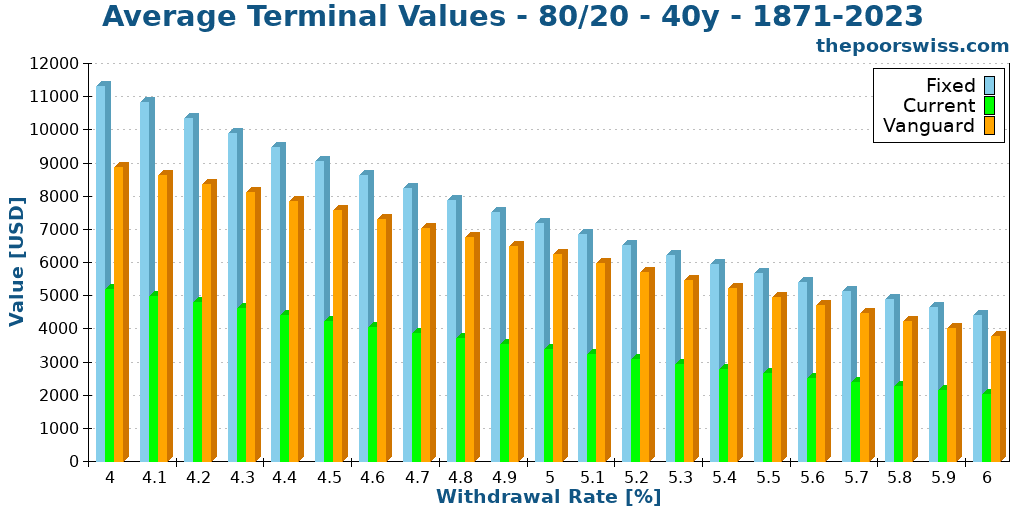
These results are very interesting. We can see a significant difference in terminal values between the different strategies. The fixed strategy is always the one with the highest average terminal value. The Vanguard is slightly below in terminal value. And the current withdrawal rate strategy is always the one with the lowest terminal value. This is interesting because the differences between the two dynamic withdrawal rate strategies are even more significant than the differences in success rate.
Average spending
The next important question is: If they generate wildly different terminal values, are they are also generating wildly different spending or simply that the spending is spread differently? One goal of dynamic strategies is to spend more money.
So, we can also at the average yearly spending of each strategy. We only look at the average for successful simulations. This is the total withdrawn in these simulations, divided by 40 (number of years). In the simulations, I use 1000 USD as the starting value.
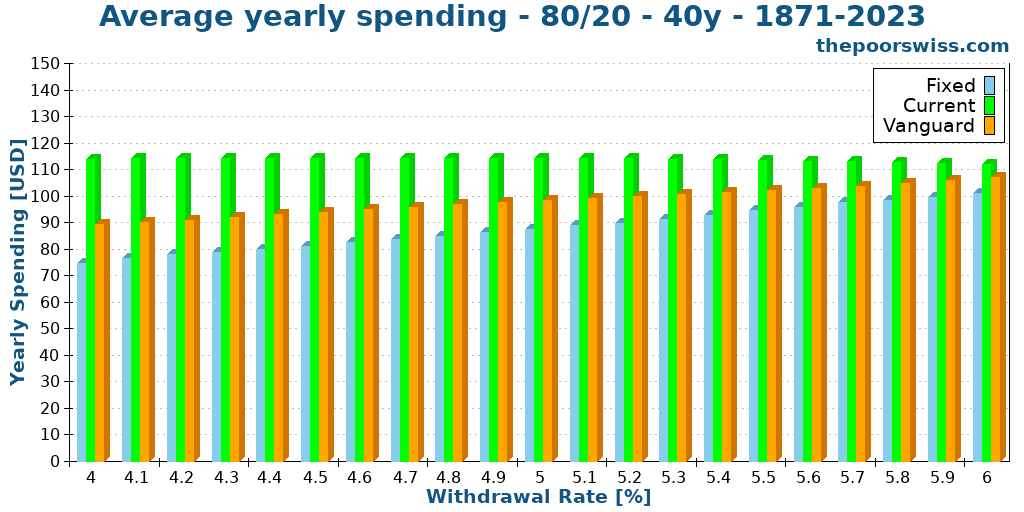
Some people may be surprised to see that the fixed rate strategy withdraws much more on average than the withdrawal rate. The reason is that the withdrawal is adjusted for inflation. So, the annual spending will go up every year.
The Vanguard dynamic spending strategy follows a similar evolution, but always withdraws more than the fixed strategy. The simple withdrawal rate strategy spends the same almost independently of the withdrawal rate. The reason is that it is very aggressive and will spend almost as much as possible, ending the average almost at the same place. If we look at the median instead, we can see significantly more variations for the strategy.
So, this tells us that dynamic withdrawal rate strategies allow spending more than a fixed strategy. And the gap gets smaller as the withdrawal rate increases.
Spending volatility
We can continue our analysis by looking at the spending volatility. By this, I mean the differences in spending over time.
First, we can look at how many years there are where the spending is 50% less than the first year. This would represent a major shift in spending.
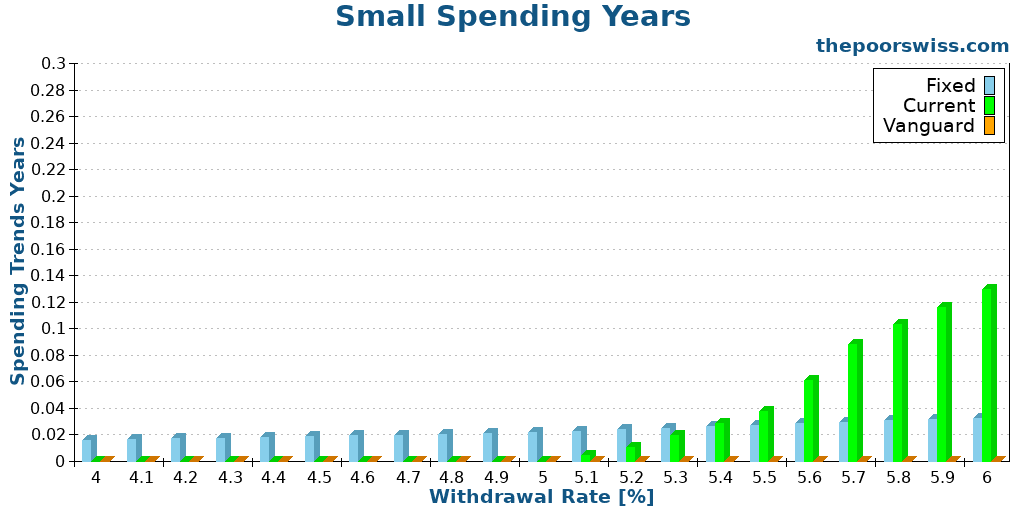
These results are less interesting than I expected. The chances of a year with less than 50% of the first are very low. The chances are almost constant with the fixed strategy. Only the current strategy goes up with the withdrawal rate. However, the Vanguard Dynamic Spending strategy eliminates this case.
Another interesting metric to look at is the percentage of years when we would spend at least 10% less than the previous year. For many people, a 10% reduction in spending in a single year is already significant.
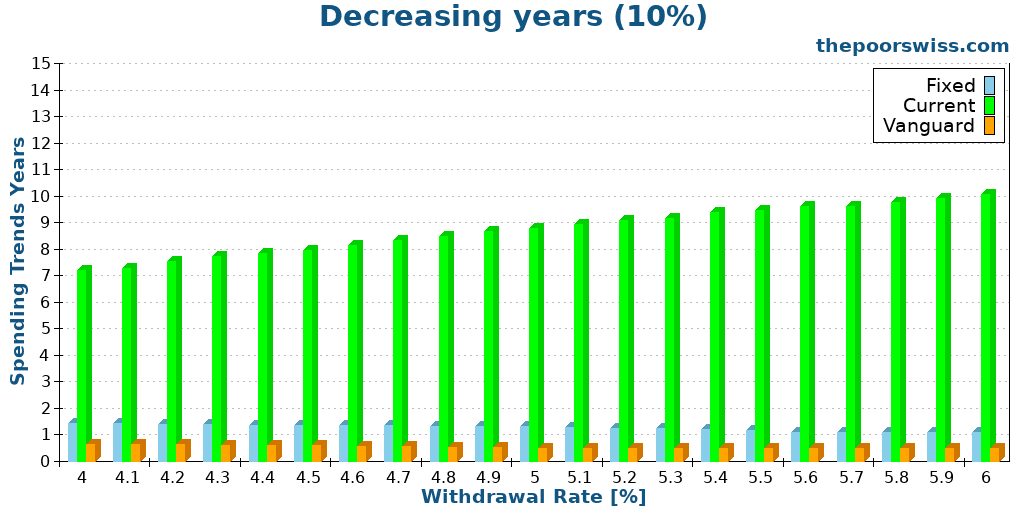
These results are more interesting. We can clearly see that the current dynamic withdrawal rate strategy has a much higher probability of a year when we have to cut spending by at least 10%. Even with a small 4% withdrawal rate, we still have a 7% chance of having to do that. And it jumps to 10% with a 6% withdrawal rate.
Vanguard Dynamic Spending protects quite well against that with its rule. But in some cases of low portfolio and deflation, it can still happen. Even the fixed withdrawal rate strategy has a chance of that happening with negative inflation.
A lower minimum
In these results, we have observed that what matters the most to these dynamic withdrawal rate strategies is the minimum withdrawal. In all our results so far, we have set the minimum to 4% of the initial portfolio.
Here is the success rate of our dynamic withdrawal rate strategies, with a minimum of 3%. The minimum is still adjusted for inflation every month.
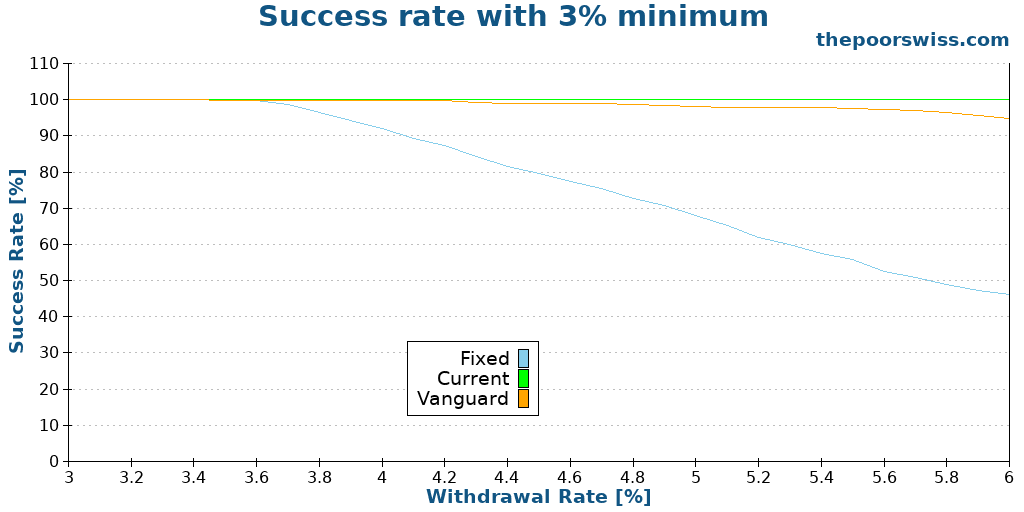
Even with a 6% withdrawal rate, both of our strategies would have more than a 90% success rate. And the simple dynamic withdrawal rate strategy would even have a 100% chance of success.
Does that mean we should use a small minimum and a high withdrawal rate? Not necessarily. This provides a huge advantage indeed. But it also has a giant disadvantage: spending from one year to another will massively vary.
The Vanguard Dynamic Spending strategy will at least offer some protection against these variations by limiting the variations from one year to another. However, the simple dynamic withdrawal rate strategy would offer no such protection. And you could find yourself having to reduce your expenses by 30% or even more in a single year with this strategy.
Can you reduce your expenses by 30% in a single year? Most people cannot (I sure cannot).
Some people will argue that you can take the opposite approach and have all your necessary spending mapped out to the minimum withdrawal rate. And then, everything else on top is a bonus that you can use to increase your lifestyle. For some people, this can work. But this has two overlooked issues.
First, after a few years of travelling 3 months a year and eating out, can you go back to not travelling? Practically, you can, of course, but some people will be very unhappy in the process. And second, some of your discretionary spending may have long-term effects on your spending. For instance, If you buy a new car, you may increase your maintenance expenses. So, in your flexible spending, you have to be careful about long-term costs.
If you really want to be flexible in retirement, you will need to map out exactly how much you absolutely need to live. This is the bare minimum you need to live. And then, you need to estimate how much you want to spend extra. You have to make sure all these extra expenses can be cut quickly, without making you depressed. And from there, you should have an idea of what you can do in retirement.
But I would still recommend caution because most people will be too optimistic. Increasing your minimum by 10% and reducing your extra expenses by 10% could add some margin of safety to your retirement plan.
Other dynamic withdrawal rate strategies
In this article, I have only covered two dynamic withdrawal strategies in detail, but there are others.
An interesting strategy is the so-called Sensible Withdrawals strategy. This is a variation of the simple dynamic strategy. You keep the base withdrawal rate of the value of the portfolio and add a second withdrawal rate that sets how much you can withdraw out of last year’s earnings.
Another intriguing strategy is to base the withdrawal on valuations. One popular measure of doing that is the CAPE ratio, which is a measure of the price related to earnings, smoothed out for inflation. The idea is that a high CAPE value would help in predicting market cycles and help to withdraw appropriate amounts.
And it can go much more complicated than that. For instance, the Guyton-Klinger strategy changes the withdrawal based on three different rules. The first rule will decide whether we should adjust withdrawal for inflation or not. And the two other rules (each with two parameters) try to avoid depleting the capital.
There are others, but this gives us an idea of what is possible in this field. If you are interested in actual simulations with these other dynamic withdrawal rate strategies, please let me know in the comments below.
Conclusion
Dynamic withdrawal rate strategies can achieve higher success rates by varying the withdrawal rates over time. The idea is that we can spend more when the market is good and less when the market is bad.
These strategies have a lot of value. However, we have to be cautious that they incur significant variations over withdrawal amounts. Indeed, the whole point of these strategies relies on flexibility. Many people think flexibility is easy, but if you have to cut your spending by 20% in a single year, you may be surprised to find that flexibility can be hard.
I like the idea of the Vanguard Dynamic Spending strategies because it controls the variability of spending. However, it can fail earlier because it is also slow to decrease the withdrawals. I may experiment further with the parameters of this strategy.
Both of these dynamic withdrawal rate strategies allow spending more money. As a result, using them, you can increase your withdrawal rate (since the success rate is higher), and you could, in theory, retire earlier. You will have to be cautious about the flexibility. You only get these success rates by following the method.
There are other methods to change spending. I wrote about two interesting withdrawal methods that aim to deplete the portfolio instead of finishing with high terminal values.
If you liked this article, you may like my article about integrating social security into your retirement plan.
What do you think about these strategies? Do you want me to cover other dynamic withdrawal rate strategies?
More reading

What is a failsafe withdrawal rate?
Is any rate safe? We explore if a "failsafe" withdrawal rate exists for early retirement and how to protect your portfolio from total failure.
All you need to know about the Trinity Study
The 4% Rule explained. Learn about the famous Trinity Study, how it determined safe withdrawal rates, and what it means for early retirement.
How to implement the Trinity study in 2026
Apply the 4% Rule. Practical steps to implement the findings of the Trinity Study in your own retirement plan and withdraw funds safely.
Learn easy ways to optimize your finances and save thousands in Switzerland with our exclusive e-book. Learn about the most cost-effective financial services tailored for savvy residents and expats!
Get Your FREE Swiss Money-Saving Guide
Hi Baptiste,
In regards to the terminal values, I think the fixed withdrawal changes during deflation while Vanguard only can reduce by 2% in your example.
Note – Vanguard usually uses 5% decrease.
Thanks for the great website,
James
Hi Jim
Are you saying Vanguard is now recommending a 5% decrease instead of a 2% decrease?
What do you think about VPW (variable percentage withdrawal)? https://www.bogleheads.org/wiki/Variable_percentage_withdrawal
It sounds interesting. And it has the advantage of being well supported with a spreadsheet, but it also sounds a bit complicated because the withdrawal rate will change each year.
I may try to include it in my next article about retirement but the rules are not ideal to extract from the spreadsheet.
Hello Baptiste,
Very nice article and a lot of work.
But I’m more confused than before. I thought 4% fixed withdraw means you take out 4% from your portfolio no matter how is the market, but actually this is simple dynamic?
Fixed means you withdraw fix amount of money, not %, every year?
Thank you for your answer, then I’ll have to read the article again
KR
Constantin
Hi Constantin
The standard withdrawal rule (in Fixed Withdrawal Rate) is simply an example to compare against other strategies, it’s not a dynamic strategy. You will take 4% of your initial portfolio (not your current portfolio). The only thing you change is adjust for inflation.