Can you retire with cash instead of bonds?
| Updated: |
(Disclosure: Some of the links below may be affiliate links)
This last decade, bonds have performed poorly, especially in Europe. So, many people wonder why they should have bonds in their portfolios.
I have never owned bonds. However, I still like the idea of having safe assets in my portfolio. But bonds being what they are, what do we have left? Cash is still a safe asset, even safer than bonds. However, the returns are pretty bad.
Can you retire with a portfolio of stocks and cash? In this article, I redo the results of the Trinity Study, using cash instead of bonds. The results are pretty surprising!
Cash vs Bonds
I am not talking about cash under your mattress. I am talking about cash in an interest-bearing bank account.
People generally use bonds in their portfolios to reduce volatility. Bonds are generally an essential part of asset allocation. However, you can also use cash for that. Historically, people have recommended not having cash in your portfolio because the returns are too low, and your cash would be eaten by inflation.
And indeed, the returns of cash are significantly lower than the returns of bonds. Historically, in the United States, cash has returned between two and three times lower returns than bonds.
On the other hand, cash is significantly less volatile than bonds. Again, in the United States, cash has never seen negative interest rates. It means that your cash cannot go down. However, bonds have seen significant declines in value in the past.
So, if the goal is to reduce volatility, would it not be interesting to use cash instead of bonds?
To find out, I have reproduced the results of the Trinity Study with both US bonds, cash and inflation. So, we will see whether we should hold cash or bonds. If you want to know how I am doing these simulations, you can read how I updated the results of the Trinity Study.
I define success asthe retirement period with more than zero. It is a success with 1 USD or one million, no difference. And the success rate is the number of successes divided by the number of possible starting months.
30 years of retirement with cash
First, we start to see how several strategies with cash and bonds would fare for 30 years of retirement. Thirty years is the point at which these simulations become interesting. Below that, almost every strategy can last long enough.
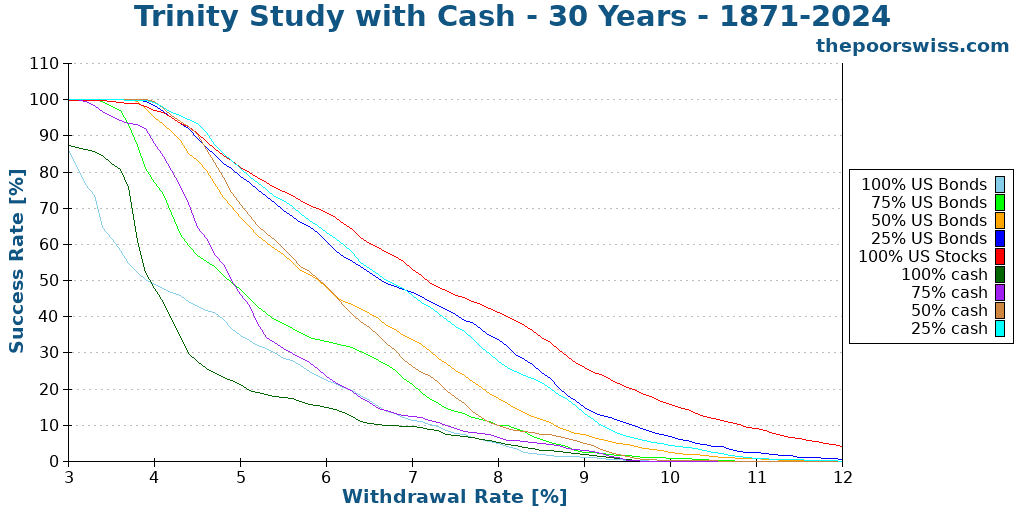
We can observe a few things already:
- You need stocks in your retirement. Any portfolio with 100% bonds or 100% cash is bound to fail faster than 30 years, even with a low withdrawal rate.
- You need a reasonable withdrawal rate. After 5%, things start to go wrong pretty quickly.
So, we focus on 3% to 5% for our results:
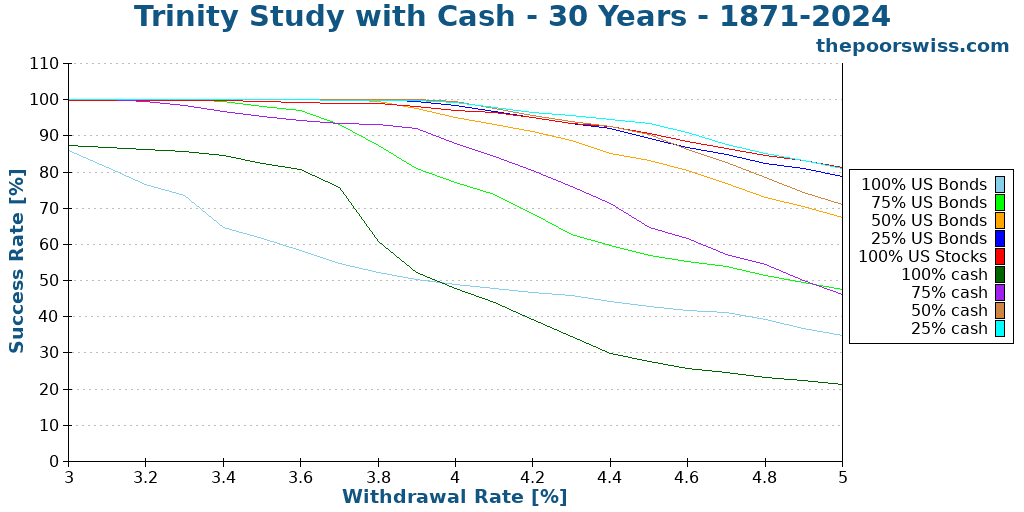
We can already see better in this graph. Interestingly, most strategies do very well for 30 years. Thirty years is not a huge deal historically.
We can quickly look at the 100% bonds and 100% cash strategies. We can see that they do not fare well. The reason is that their returns are too low to overcome the withdrawals, even over 30 years.
But we can also observe one crucial thing: With a low withdrawal rate (below 4%), 100% cash performs significantly better than 100% bonds. On the other hand, with a higher withdrawal rate, 100% bonds start to perform better. This result shows that a low withdrawal rate needs low volatility while a high withdrawal rate needs higher returns.
However, even with a 3% withdrawal rate, neither of these two portfolios without stocks would do better than 90%. So, we ignore them for now and see the other better.
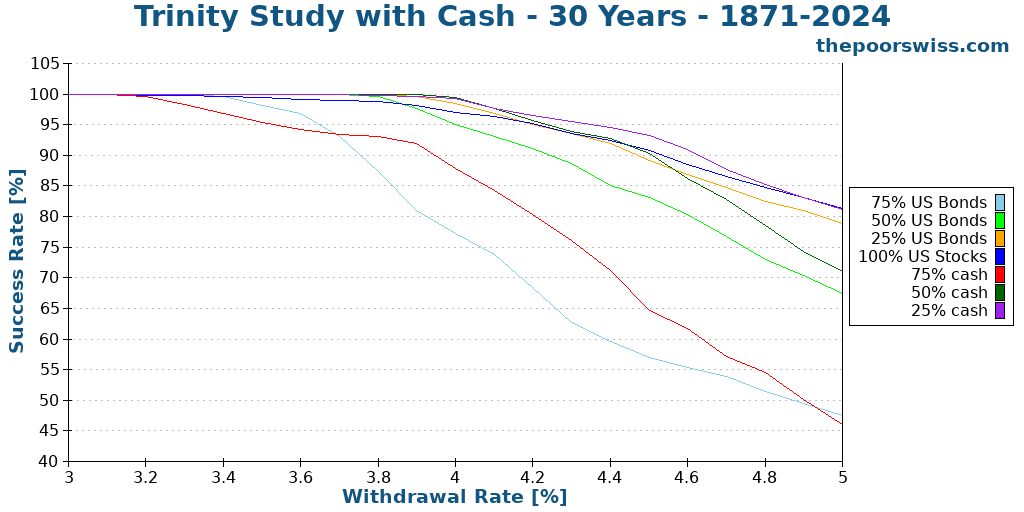
At this point, any of the remaining strategies would do very well with a 3.5% withdrawal rate. Here are the success rates at a 4% withdrawal rate:
- 75% Bonds: 84.02%
- 50% Bonds: 93.80%
- 25% Bonds: 97.58%
- 75% Cash: 94.49%
- 50% Cash: 98.82%
- 25% Cash: 98.41%
- 100% Stocks: 97.65%
The 75% bonds portfolio seems too risky at this stage. But the other portfolios are doing quite well. It is extremely interesting to note that the best portfolio is 50% cash. I did not expect that! 25% cash is also quite good, slightly ahead of 100% stocks. Interestingly, none of the bond portfolios are doing better than investing fully in stocks.
But this shows that for 30 years of retirement, having either 25% or 50% cash was historically very interesting.
40 years of retirement with cash
However, 30 years is still short. We should see what happens with longer retirement periods. So, we start with 40 years of retirement.
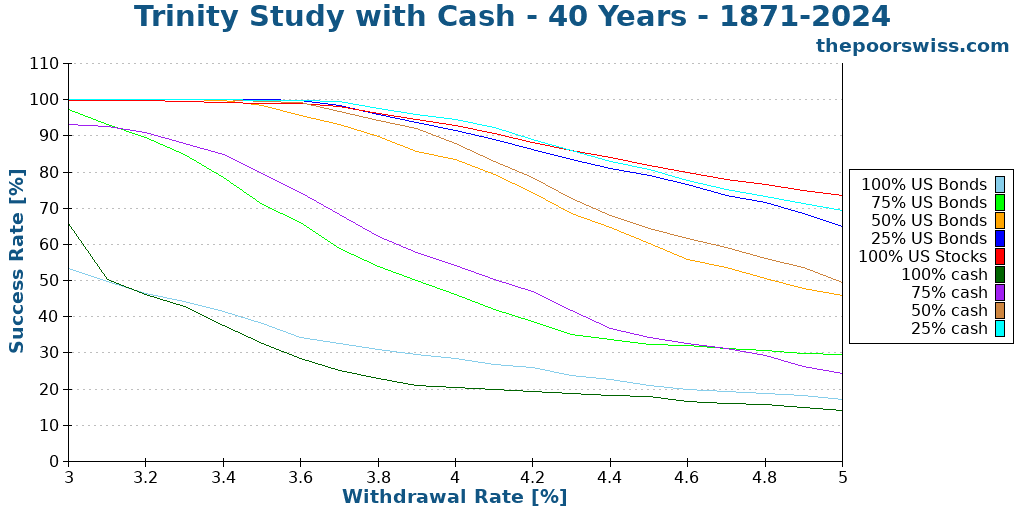
Several portfolios are now having a harder time. The portfolios with 100% stocks and bonds are now failing hard.
We get our first conclusion: Bonds and Cash should be coupled with stocks. We can remove them to make the graphs easier to read.
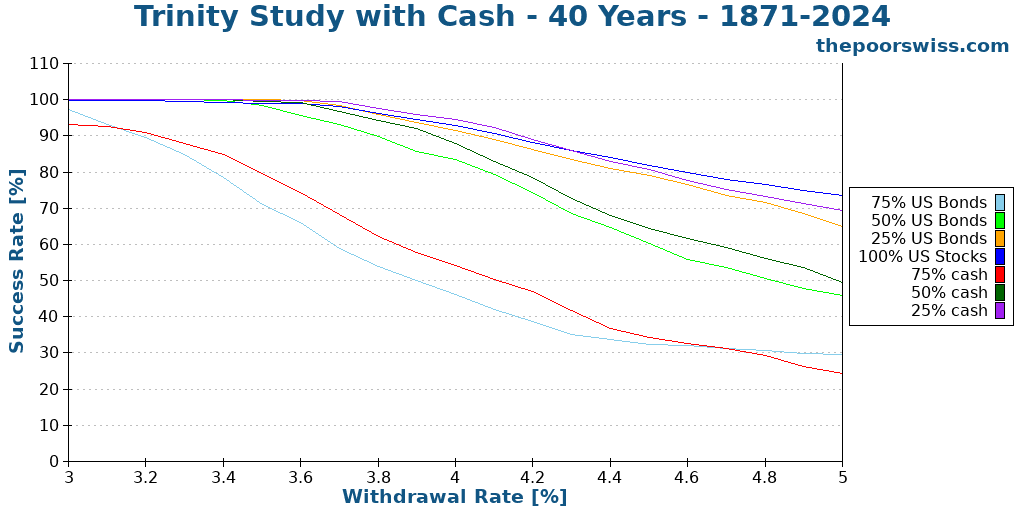
The differences between the different portfolios are now more significant than before. The two portfolios with 75% cash and bonds are now significantly riskier.
We can compare all the successful strategies at a 4% withdrawal rate:
- 50% Bonds: 82.35%
- 25% Bonds: 89.56%
- 50% Cash: 87.38%
- 25% Cash: 92.92%
- 100% Stocks: 93.76%
Interestingly, all the cash portfolios perform better than the bond portfolios at this withdrawal rate. The 100% stocks portfolio is now the best due to its higher returns.
If we take a lower 3.5% withdrawal, we get an almost 100% success rate for 100% stocks, 25% bonds, 25% cash, and 50% cash. Interestingly, a 25% bonds portfolio would give a 100% success rate at a 3.5% withdrawal rate. However, the 50% bonds portfolio would perform significantly worse than the 50% cash.
50 years of retirement with cash
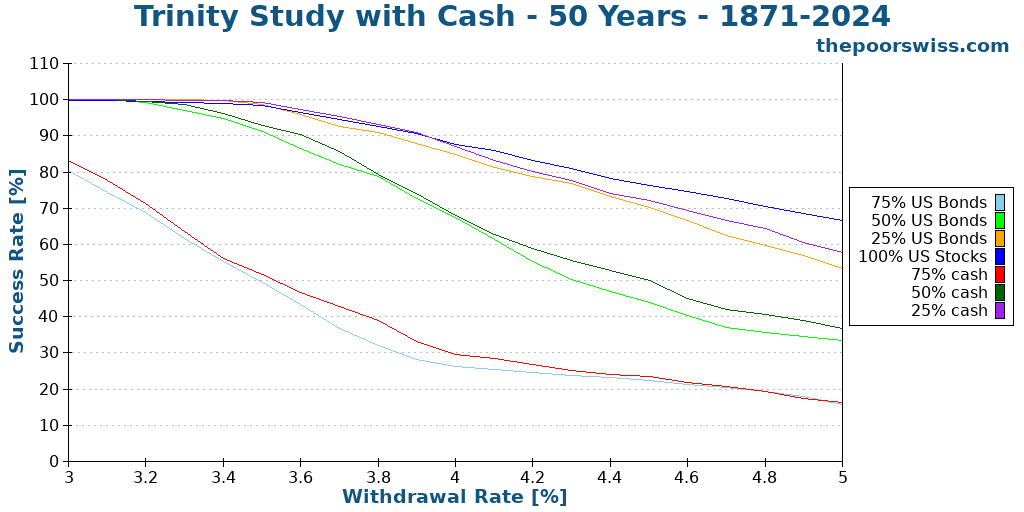
If you plan an early retirement, 50 years is a good time to plan for. So, we compare our portfolios after 50 years.
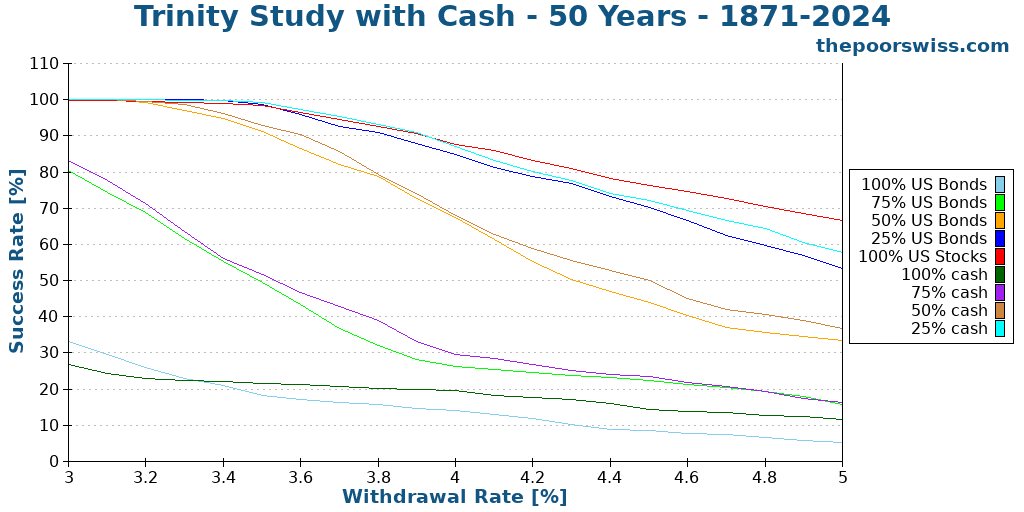
Unless you plan to use a withdrawal rate lower than 3.5%, we should eliminate the portfolios with less than 50% stocks. Their success rates are too low. Usually, you should have at least 50% of stocks in your portfolio for retirement.
Even after 50 years, our principal portfolios perform very well at a 3.5% withdrawal rate. 50% bonds is probably too risky there, but 50% cash is performing great.
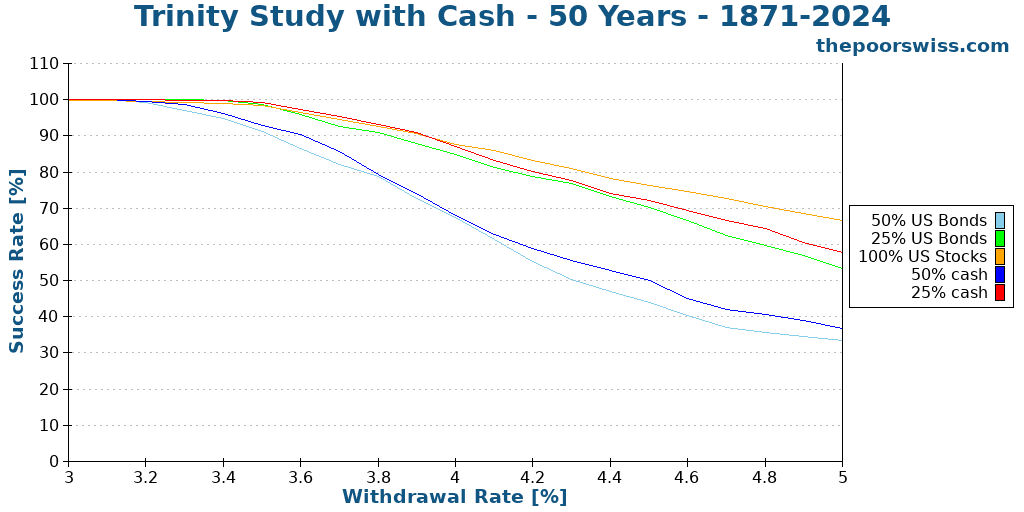
At a 4% withdrawal rate, things are starting to look risky:
- 50% Bonds: 73.84%
- 25% Bonds: 84.24%
- 50% Cash: 76.40%
- 25% Cash: 86.30%
- 100% Stocks: 89.68%
None of the portfolios achieve a 90% success rate. The 100% stocks and the 25% cash portfolios are still doing okay. It is pretty interesting, though, that cash is still ahead of bonds, even over 50 years.
We can draw our second conclusion: Using cash instead of bonds yields better success rates.
Going further than 50 years is possible, but the results are not very interesting. I think 50 years is the most interesting retirement period. On top of that, with historical data over 150 years only, 60 years periods are becoming less interesting statistically.
Terminal values
To continue comparing cash and bonds, we also need to look at the terminal values of the portfolios. The terminal value is the portfolio’s value at the end of the retirement period. A successful retirement has a positive terminal value, and a failed retirement has a zero terminal value.
Our simulation starts with 1000 USD. So, we look at the average terminal values after 30 years:
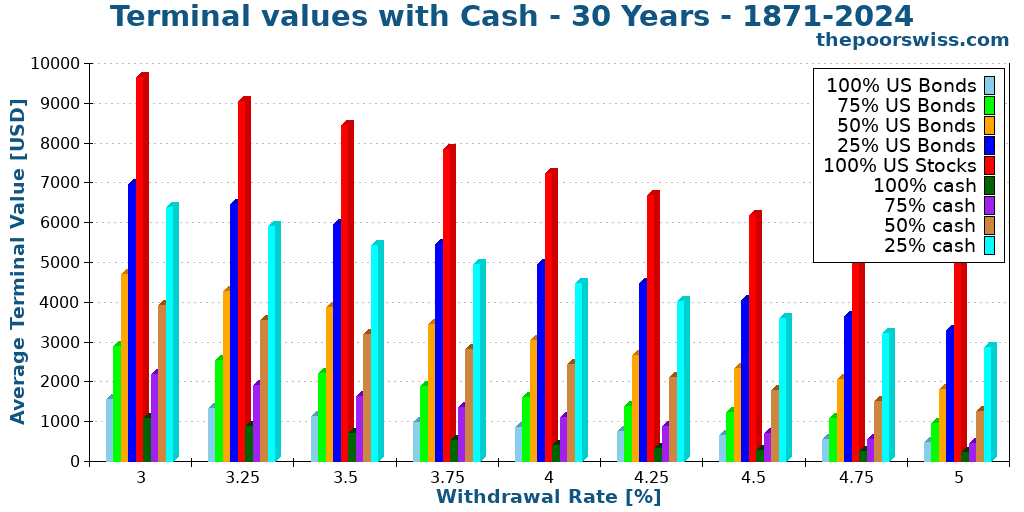
We can observe that the differences between the different portfolios are small but very regular. And we can observe the same kinds of differences with each withdrawal rate.
In each case, a portfolio with some cash ends up with slightly less terminal value than a portfolio with the equivalent in bonds. This result makes sense since cash returns are lower than bond returns.
If you have never seen this chart, you may be surprised to see that, on average, we end up with significantly more money than we started with, even with a 4% withdrawal rate. And indeed, the average is very high because it skews toward the extremes. But the minimum is often zero because you can end up with nothing.
We should see whether this holds for 40 years.
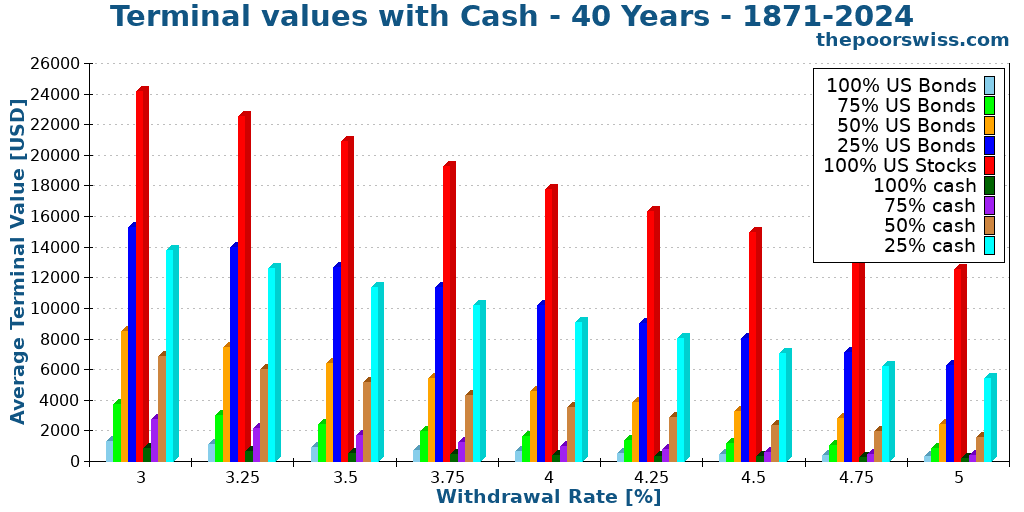
After 40 years, the situation does not change much. Bonds are always slightly ahead of cash. And having more stock means you end up with significantly more money, which makes sense since, on average, the returns of the stocks far outweigh the withdrawal rate.
We can then draw our third conclusion: Using cash instead of bonds results in slightly worse terminal values.
Worst duration with cash
Until now, we have focused on the success rate. It is an important metric, but it is not the only metric. Generally, the success rate will show that a more aggressive strategy has a higher chance of success, especially with a higher withdrawal rate.
The second interesting metric is the worst duration. The worst duration indicates the earliest a strategy can fail. For instance, a 95% success rate strategy could fail after 200 months, while a 93% strategy could only fail after 400 months. So, in practice, balancing good success rates with high worst durations is a good idea.
For reference, here are the success rates for 50 years for all our portfolios:

And here are the worst durations for the same portfolios:
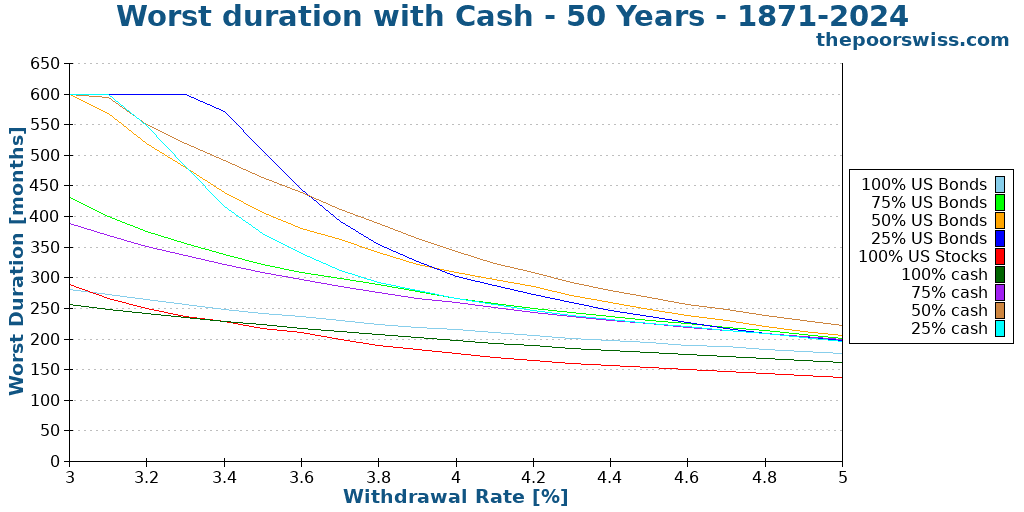
We can already observe that the graphs are significantly different. Having a good success rate does not mean having a good worst duration.
On the other hand, some portfolios are bad at both. Portfolios with 100% cash and 100% bonds are bad at both, making them very poor candidates. We remove them from our graphs to see better.
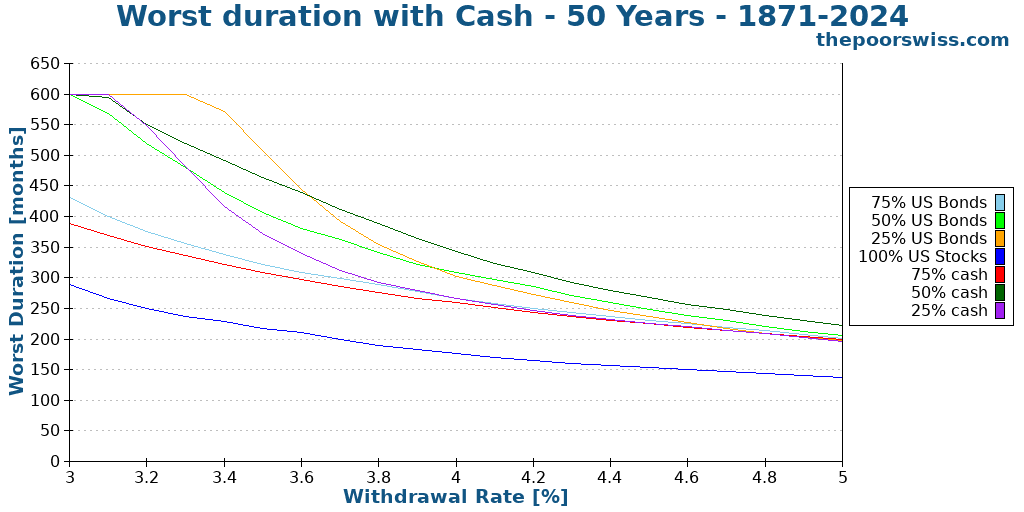
We can observe something interesting: a portfolio with 100% stocks is generally the best for success rate but the worst for the worst duration. This is an important point! The volatility of stocks is very high, making it possible to fail very early. On the other hand, the returns are also very high, making it good on average.
We can see several interesting things in these results. First, adding some bonds perform better in the worst duration than adding some cash. This effect is contrary to the effect on success rate. Then, adding 25% cash is not enough to counter the poor success rate of 100% stocks. We need at least 50% cash for that.
We can then draw our fourth conclusion: Using cash instead of bonds results in a slightly shorter worst duration.
To summarize everything in a graph, I have created an additional chart with the normalized values of both previous graphs. I have called this normalization, the quality, and it is measured as the average of the success rate (divided by 100) plus the worst duration (divided by 600). It is the first time I have used this metric. Let me know what you think.
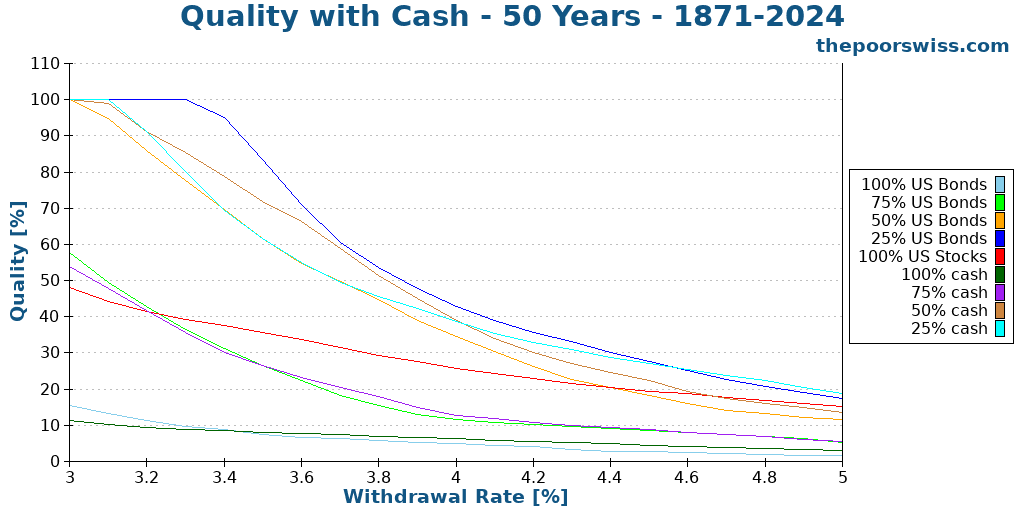
As expected, the two portfolios without stocks performed very poorly. This result makes sense since they are bad at both metrics. But other things become very interesting in this graph. The 100% stocks portfolio starts poorly but becomes more interesting as the withdrawal rate increases. This makes sense since this portfolio has the highest returns, and a high withdrawal rate needs high returns.
Again, 25% bonds perform better than 25% cash. The portfolio with 25% bonds performs best at a 3.5% withdrawal rate.
With a 4% withdrawal rate, three portfolios are performing similarly:
- 25% cash
- 25% bonds
- 50% cash
Then, 50% bonds and 100% stocks are close behind. It is also interesting to note that the portfolio with 25% cash is the best for withdrawal rates higher than 4.2%. However, I would not rely on more than 4% for such long retirements.
Everybody has to choose the balance between success rate and worst duration. In this last graph, I have applied the same weight to both. But some people would prefer more weight on the success rate, for instance.
Conclusion
Overall, this does not change fundamentally how people should approach retirement. However, this shows that the difference between cash and bonds is less significant than people assume. Indeed, while it has lower returns, cash also has lower volatility. Coupled with the high returns of stocks, cash is quite interesting.
We can take back our conclusions:
- Bonds and Cash should be coupled with stocks.
- Using cash instead of bonds yields better success rates.
- Using cash instead of bonds results in slightly worse terminal values.
- Using cash instead of bonds results in a somewhat shorter worst duration.
For me, this is a very interesting result. It shows that bonds and cash are only here to supplement stocks. But they can be a great addition to a portfolio. Conservative investors will prefer bonds over cash. But even an aggressive investor could profit from having a small percentage in cash for retirement.
I still have a 100% stock portfolio, which makes the most sense in the accumulation phase. I plan to have bonds in my portfolio when I retire. If bonds are negative again when I retire, I may replace bonds with cash.
If you want to see more results like this, read my article on how often you should withdraw in retirement or whether you should rebalance in retirement.
What do you think of these results?
More reading

What is a failsafe withdrawal rate?
Is any rate safe? We explore if a "failsafe" withdrawal rate exists for early retirement and how to protect your portfolio from total failure.
Happily Back to work after 1 year of retirement – Dror’s Story
After one year of retirement, Dror is going back to work and building a coaching business. We catch up and see what happened!
Grow Your Income or Spend Less to Reach FIRE in 2026?
Reach Financial Independence faster. Learn why growing your income is just as important as spending less and how to widen the gap to save more.
Learn easy ways to optimize your finances and save thousands in Switzerland with our exclusive e-book. Learn about the most cost-effective financial services tailored for savvy residents and expats!
Get Your FREE Swiss Money-Saving Guide
Thanks for this interesting analysis, I’ve always wondered why cash received so little attention :)!
– I assume your results take into account inflation?
– I’m really wondering how a mix of cash and bonds would do (to combine the best of both worlds)?
– In a previous article you advised against holding a cash cushion in retirement. Have you changed your opinion on that matter?
– Do you know why simulations such as cFIREsim only indicate success rates, but not worst durations? I get the feeling that worst durations don’t get the attention they deserve.
Hi Roberto,
* Yes, this uses US inflation
* Good question, I may try to figure out later
* A cash cushion and cash in the portfolio is different. The cash cushion is an extra pile of cash not counted in the portfolio. My opinion has not changed on that.
* I don’t know :) My first simulations also used only the success rate then one reader suggested the worst duration.
Thanks for taking the time, greatly appreciated, keep up the good work :)!
I find the “worst duration” factor you analyze quite unique, I know of nobody else looking specifically at this, despite it being crucial for retirement portfolios!
Really curious how that would work out for a stock-bond-cash mix, if you ever find the time to check this :)!
All the best!
Wow, a very valuable analysis! Thanks! I expected the difference between bonds and cash to be much more significant. Very interesting!
I expected the same. I am glad you like it, Mark!
Is this analysis done for a portfolio in USD ? I guess the result would be different once converted to CHF. Especially for Bonds and Cash where FX-risk (or performance) would have a significant impact on these stabilizing assets. In my case I’m using CHF-hedged ETFs for Bonds to reduce volatility because that’s the purpose of having Bonds in the portfolio. ( As I started in Dec-2021 with a large capital, I can’t say that I have a long or a good track-record though :O )
Moreover, historical FX-data may create a bias in the result as well because the CHF has been stronger and stronger against USD for many years. This long-term trend may not continue in the future (of course nobody knows).
Hi,
This is indeed all done in USD, with US stocks , bonds and cash.
And indeed, doing the same with CHF bonds would yield different results.
Personally, I would not use any bond other than CH bonds since using US bonds, even hedged, would not achieve the same goal for me.
I have done an analysis of retirement with CHF.
Hi Baptiste,
Very interesting analysis, thanks for it.
About the chart Average Terminal Value Vs Withdrawal Rate – 40 years: I was wondering if wouldn’t be more informative to use the median terminal value (MTV) instead of the average terminal value since (ATV) since, as you also noticed, a few unlikely extremely positive outcomes may (especially for aggressive portfolios) heavily affect the ATV. I would be curious to see this modified chart (including also 100% stocks portfolio) in an updated version of this article to see how lower would be the MTV compared to the ATV and if the results at different Withdrawal Rate of a 100% stocks portfolio is in another order of magnitude or somehow comparable to the MTV of less aggressive portfolios. Thanks for considering this.
Cheers,
Marco
Hi marco,
Yes, in practice, we should use the median rather than the average because it’s less sensitive to extremes. In that case, the difference is not huge but still significant. In any case, for me, neither the average nor the median terminal value are very valuable. I prefer the worst duration and success rate metrics.
If I ever update this article, I will consider replacing the average by the median!
I agree with Marco. Having a view on the Median would be helpful and more meaningful.
Here’s also another idea, open source the data and code behind so people can play with it and simulate based on their own personal believes and hypothesis.
Hi ILS,
All the data and code are already opensource: https://github.com/thepoorswiss/swr-calculator
Hi Baptiste,
Thank you very much for your thorough analysis and interesting result that I did not expect.
Just by curiosity, what is the cash yield you used?
These results, will make me think when I will need to choose how to balance my portfolio.
Cheers, S
Hi S,
This is a proxy for historical cash yield, implemented with 3-month US treasury bills (very close to cash yield).
Thank you Baptiste,
Another interesting and thorough analysis.
You make us think about 50 years in a period where the market is rocking hard. :)
It’s good for an investor like me who is betting on his capital to last. And like you, I don’t use bonds but a mix of cash and secured products with low returns. (65% ETF shares 35% type of cash)
Keep going with the good work.
Hi Dror,
These days, it’s indeed hard to think about 50 years in the future when we are in a bear market :)
And indeed, this is a refreshing result for people already with cash.
Thanks for sharing!