Updated Trinity Study for 2026- More Withdrawal Rates!
| Updated: |
(Disclosure: Some of the links below may be affiliate links)
Would you like to know precisely which withdrawal rate is safe and will sustain your lifestyle for a long time?
You will find the answer in this article, with updated results from the Trinity Study! This study researched different withdrawal rates for retirement. Although the original research was not about early retirement, it is often referred to in the Financial Independence and Retire Early (FIRE) movement!
However, there are two caveats to the original study. First, they are only covering the period until 1995. And then, they are not covering more than thirty years of retirement. Thirty years is not enough for some people wanting to retire early.
Therefore, I reproduce the original study’s results with recent data all the way to 2025! And I extended the data back to 1871. This makes for much more data than the original study.
I have also considered periods as long as 50 years. It means many more withdrawal simulations than the original study.
In this article, you will find how I did it and all the results I have gathered from this data!
The Trinity Study
I have already talked at great length about the Trinity Study. It is an excellent research paper done by three professors from Trinity University.
Their research paper’s goal was to see which withdrawal rates people should use to sustain a particular lifestyle for up to 30 years. It is important to note that the original research was not about early retirement but official retirement.
It is important to emphasize that we are talking about sustaining a lifestyle (expenses), not capital. So, if you end up with 1 USD at the end of the retirement period, this is a success. If you want to sustain your capital in retirement, it is a different success criterion not treated by the original Trinity study.
They tested the success rates of withdrawal rates from 3% to 12%. Furthermore, they tested portfolios with between 0% and 100% stocks by jumps of 25%.
The authors also took inflation into account in the results. Indeed, it is interesting to compare the results with and without inflation. Finally, they also provided the terminal values of the portfolio.
I wrote a detailed article about the Trinity Study if you want more information.
The 4% Rule (of Thumb)
The Trinity Study is the source of the 4% Rule. This rule states that if you only withdraw 4% of your initial portfolio yearly, you can sustain your lifestyle for a very long period. And your withdrawal is adjusted for inflation every year.
Some people believe that the original study shows that this will sustain forever. But this is not what the original research was about. They only tested simulations for up to 30 years.
It is better to call it the 4% Rule of Thumb. Because if you plan to retire very early, you will probably need a lower withdrawal rate. Moreover, your withdrawal rate will depend on your portfolio and asset allocation to stocks and bonds.
Why did I do it again?
If the study is excellent, why did I want to redo it? I have several reasons for that.
First, I wanted to see how this worked with recent stock market returns. The original study was only covering years up to 1995. I wanted to have more recent data. I wanted to ensure the results were holding with more recent stock market behavior. So this simulation will cover returns until the end of 2025!
Secondly, the original study only covered up to thirty years of retirement. I wanted to ensure that the portfolio could sustain withdrawals for extended periods. For people retiring early, I think that 50 years is not unreasonable.
Finally, I have to admit that I like to write code. So it was cool to write code related to this blog. And being a big geek, now I can run many simulations with the data I want. Overall, it was a lot of fun preparing the data for this article.
Ultimately, I want to extend the Trinity Study to the European markets. It will be challenging to obtain the data. But I will try to find it for as many years as possible.
How I redid the Trinity Study
My simulation uses monthly withdrawals. Most people in retirement will withdraw money monthly. It is also possible to withdraw money at the end of the year instead. But I believe that it is not common.
I have calculated all the returns monthly. Doing that makes the results much more accurate than doing it yearly. And the monthly withdrawal is updated with inflation every month as well. Every possible starting month in the available data is tested.
For this simulation, I have not done any rebalancing. For more information, I have compared different rebalancing methodologies for retirement.
Withdrawals are based on the current allocation. For instance, if your base allocation to stocks is 60%, but your current allocation is 80%, 80% of the withdrawal will be taken from stocks. If you are interested, I have explored other techniques in other articles:
Based on this simulation, I collected the same results as the original study: success rates without inflation, success rates with inflation, and terminal values.
Success rates of the Trinity Study
I start the simulation with the entire data from 1871 to 2025.
In this simulation, success is when your portfolio does not run out of money before the end of the simulation. For instance, if we simulate for 20 years and end up with one dollar after 20 years, it is a success. This is a failure if the portfolio runs out of money before that (it could be in the first year or the nineteenth year).
So, the success rate is the percentage of the months that end up with success. The higher the success rate, the better the results are.
We will see what success rates we have when we ignore inflation. We start with 20 years since I do not think anybody will care about a ten-year-long simulation. I will begin at a 3% withdrawal rate and go up to 12%, increasing by 1% at a time.
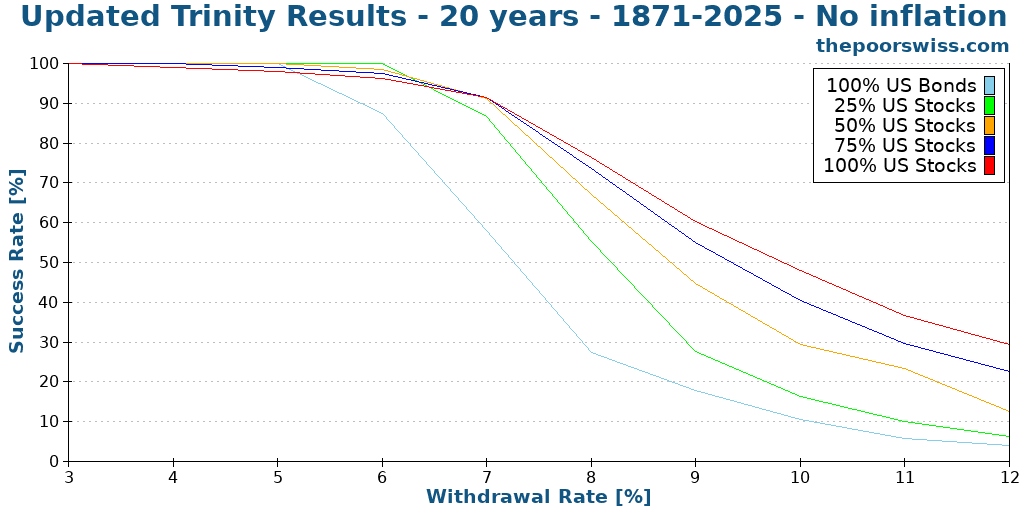
We can see what we already expect:
- Increasing the withdrawal rate decreases the chances of success
- Any withdrawal rate higher than 8% does not make sense long-term, even without inflation.
- A small allocation of bonds can help with lower withdrawal rates
- Generally, a 100% stock portfolio will perform better than the other portfolios.
Here is what happens when we push the simulation to 30 years.
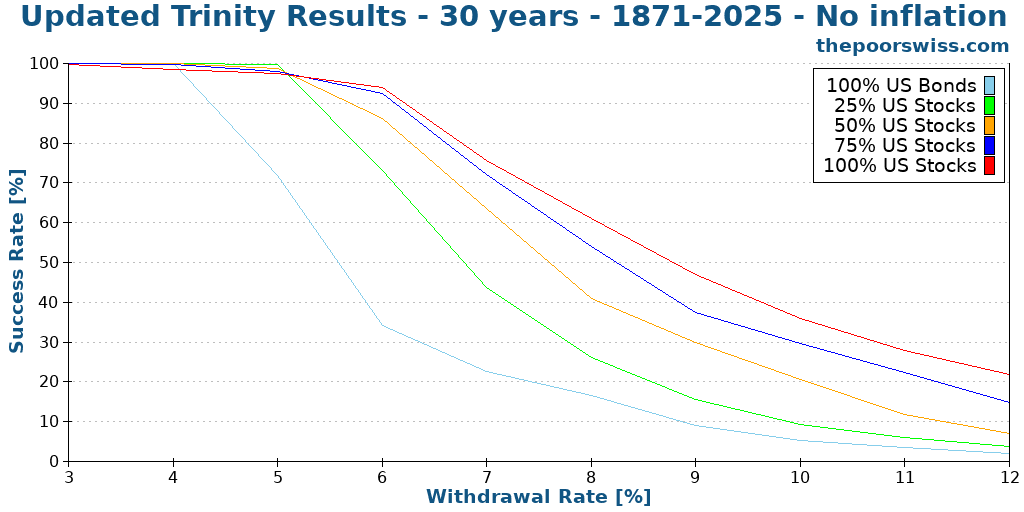
We can see that increasing the number of years decreases the likelihood of success. It is logical since you are more likely to run out of money.
With 30 years of retirement without inflation, a 6% withdrawal rate with a significant allocation to stocks still makes a lot of sense!
Taking inflation into account for retirement
However, it is much better to consider inflation in our simulation! We start again with 20 years to compare the results:
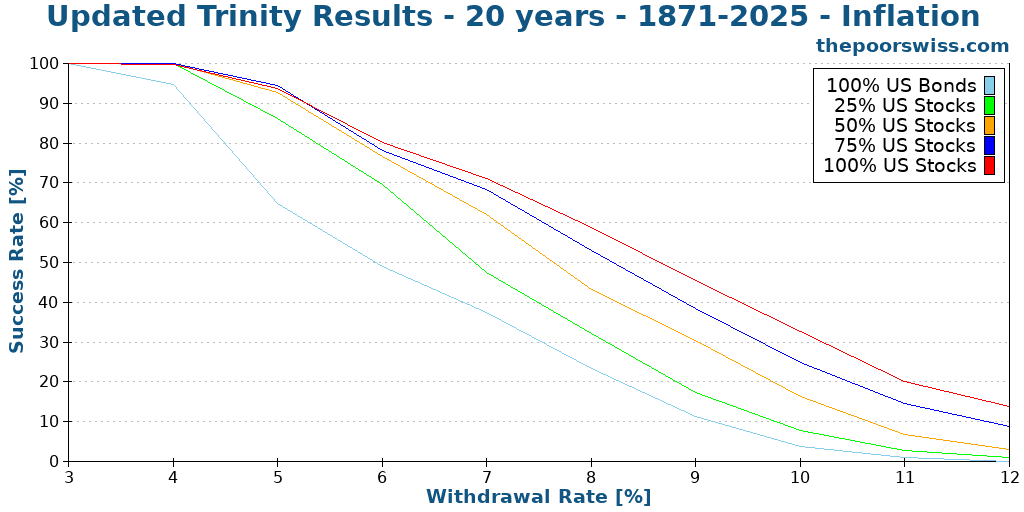
As we can see, inflation causes a significant hit to our chances of success! Before inflation, an 8% withdrawal rate made some sense. Now 6% is the limit. And even 6% has a barely over 75% chance of success!
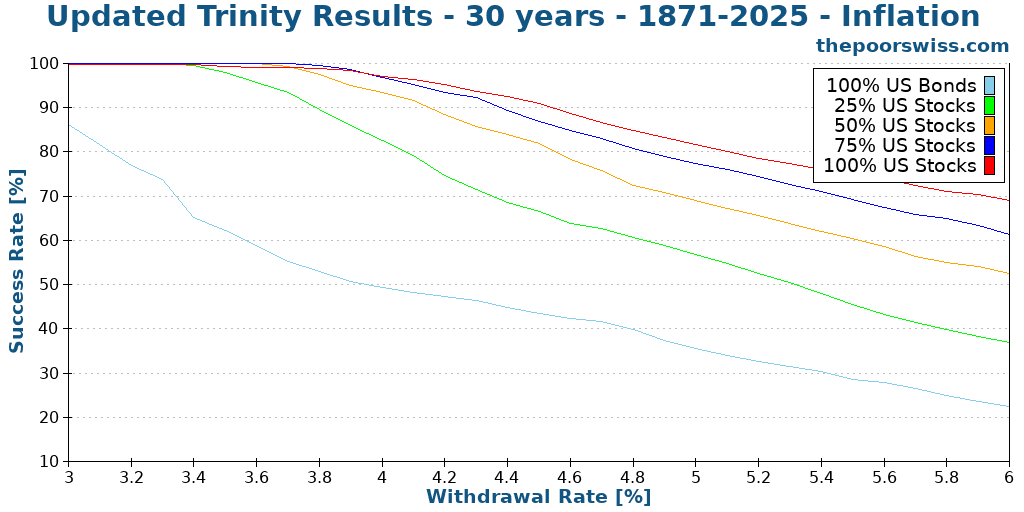
Here is what happens for 30 years of retirement.
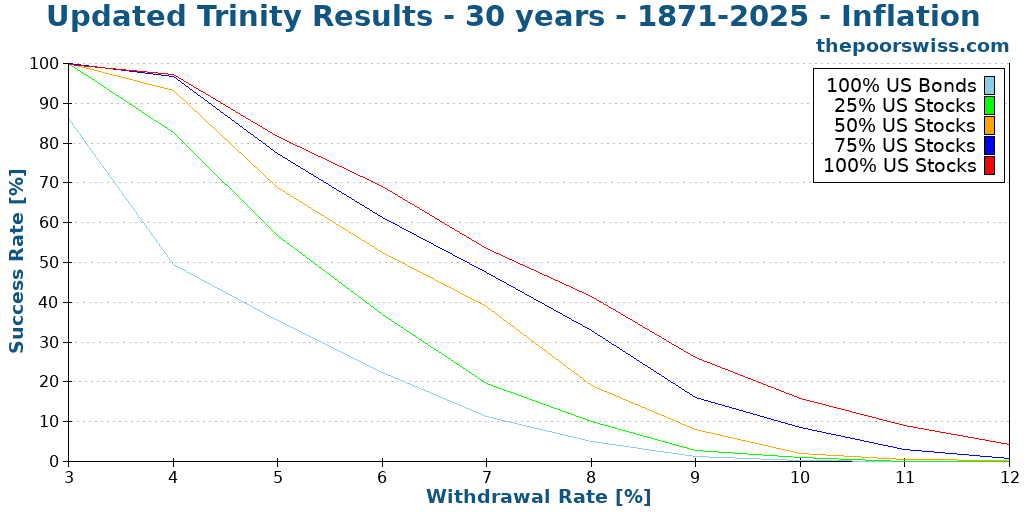
We can now see that anything higher than a 6% withdrawal rate is hazardous, with a less than 75% chance to succeed even with 100% stocks.
More withdrawal rates
Since we see that reasonable withdrawal rates are in the range of 3% to 6%, we try more withdrawal rates. I have simulated increments of 0.1% of withdrawal rates.
With a large stock allocation, withdrawal rates between 3% and 4% are very safe. Some people would even dare use withdrawal rates of about 4.5%. But even a portfolio with 100% stocks has only an 85% chance of success after 30 years with 4.5%.
Longer retirement time
One of the caveats of the original study is that they stopped at 30 years. We run the same simulation again but with 40 years this time.
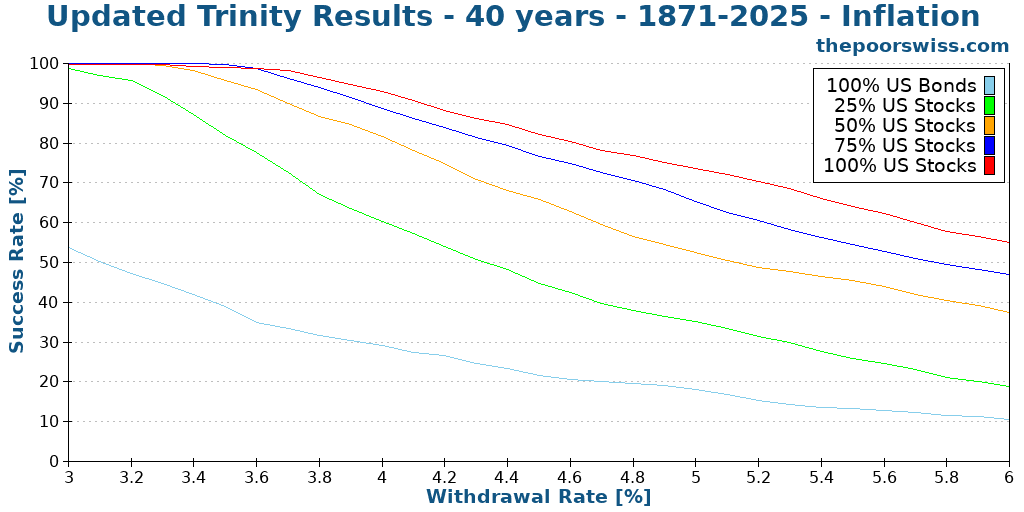
After 40 years, we are starting to see lower success rates, even for most people’s 4% withdrawal rate. Unless you have 100% of stocks, your success rate will be less than 90%.
Here is what happens in 50 years.
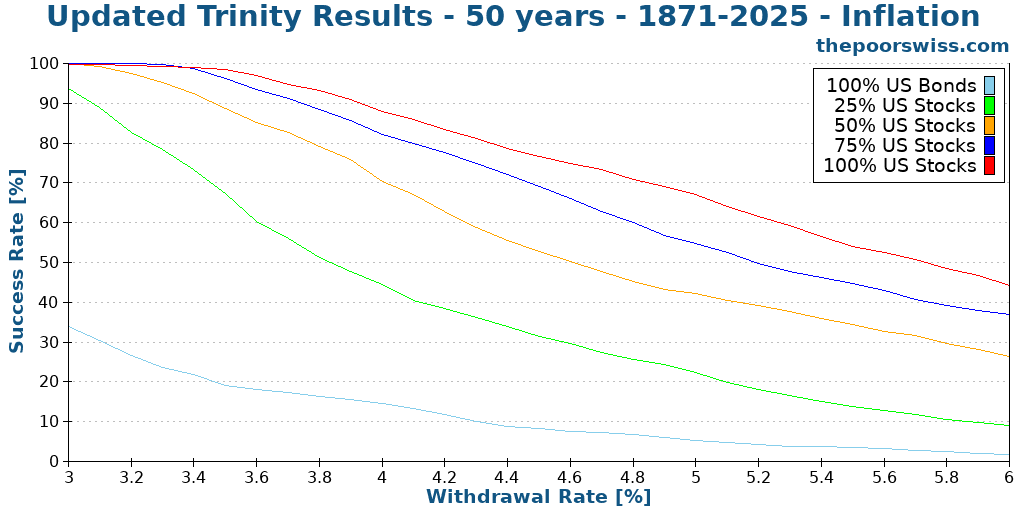
As expected, we see lower success rates. But it is still not bad at all with reasonable withdrawal rates. A 100% allocation to stocks and a 3.5% withdrawal rate still have more than a 98% success rate. This is significantly more than I expected.
It shows that the study’s original conclusion can still hold for over 30 years. It is excellent news!
Updated Terminal Values
Another interesting thing from the study was that they also compared the terminal values of the different withdrawal rates and portfolios.
So we will see the terminal values of a 1000 USD portfolio after 30 years. I did the simulation for a portfolio of 100% stocks. For the sake of display, I have reduced the number of withdrawal rates.
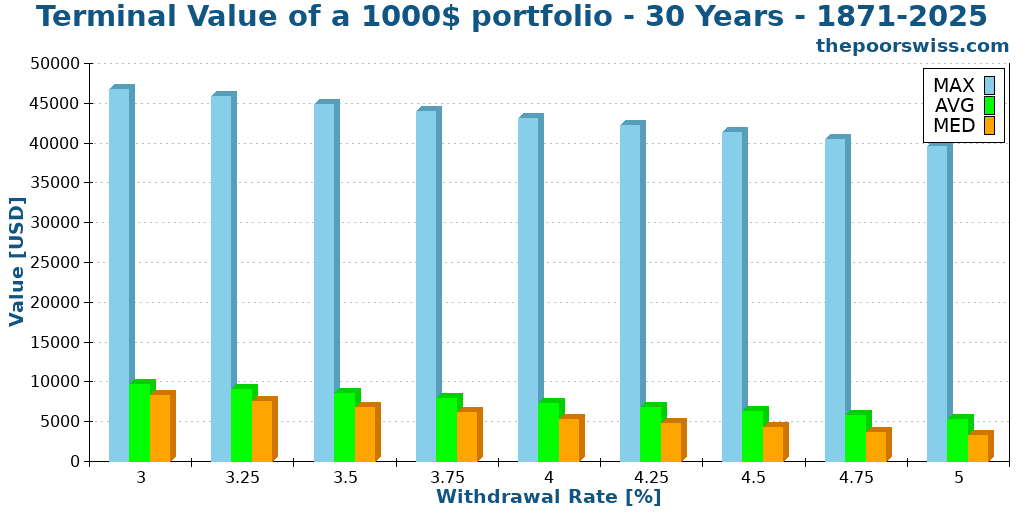
I did not show the minimum values. Indeed, they are always zero. If the chance of failure exceeds zero, the minimum value will be zero.
However, the average and median values are quite remarkable. We will focus on the median since it is generally more representative than the average.
For a withdrawal rate of 3.5%, my current target, the median terminal value after 30 years, is about 6700 dollars! Not only did your portfolio sustain your lifestyle, but it also increased sixfold! Let me repeat this. After 30 years of doing nothing but withdrawing money, you have six times more money than when you started!
The maximum values do not mean a lot. But it is crazy to see that after 30 years, you could have about 30 times more money than when you started! And this is with a 3.5% withdrawal rate!
Here is what happens when we extend it to 40 years.
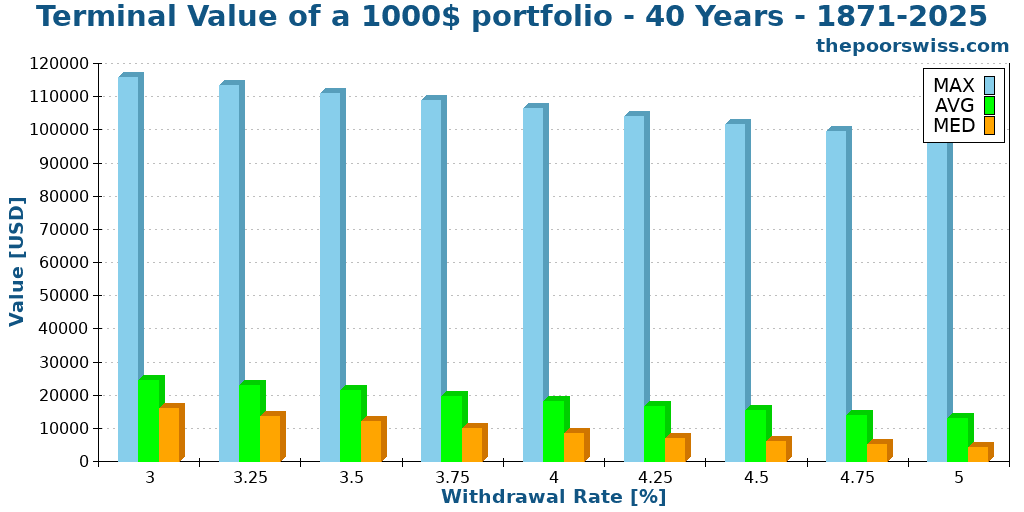
We can see that the results are comparable. However, all the values are significantly higher. The numbers are all about twice higher. On average, your retirement money will double during the ten additional years. So, even though you are not contributing more money and living from it, your portfolio will double in 10 years. How cool does that sound?
The success rate is not everything
There is something important with these measurements: the success rate does not tell the entire story. For instance, for you, which of these two scenarios is better?
- 98% to last 50 years, but a chance of running out after ten years
- 96% to last 50 years, but a chance of running out after 48 years
For me, the second scenario is better. You do not want to have a chance of failing after only ten years if you are planning for 50 years. But if it fails after 48 years, you have many years to make some adaptations.
So, another essential metric is the worst duration of a scenario. This means after how many months, the first failure can happen.
For reference, here are the success rates of each portfolio for 50 years and different withdrawal rates:

And now, here are the worst durations for each of these portfolios:
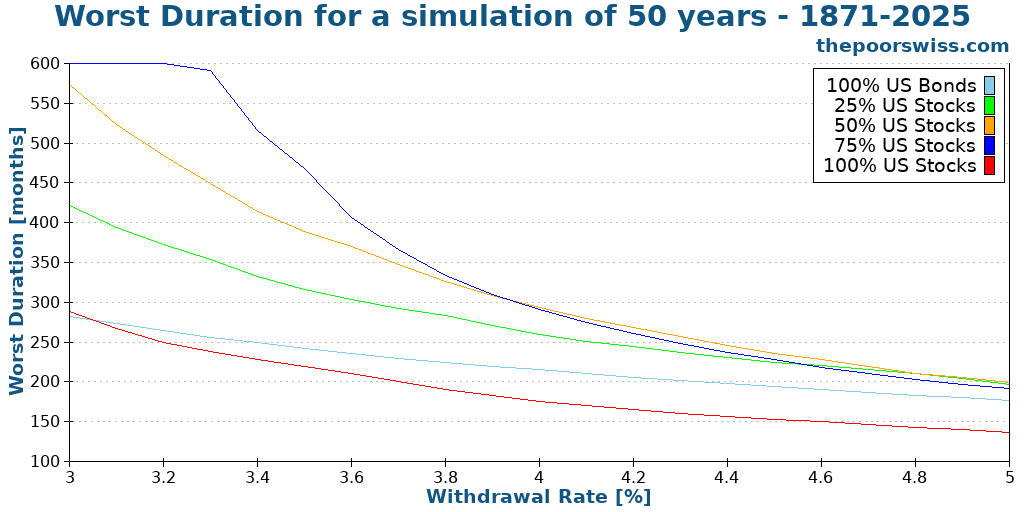
If we only look at the first graph, the conclusion is that higher allocation to stocks is always better. But if we look at the second graph, 100% stocks is the worst one!
So what does this mean: you need a balance in your portfolio. Bonds will significantly reduce the chances of your portfolio failing too early. This does not mean that you should optimize for the highest worst duration either. Because if your highest duration is 40 years, but you have only a 50% chance of reaching 50 years, this is gambling, not planning.
So balance is essential. While stocks will increase your success, stocks are more subject to sequences of return risks.
How to implement the Trinity Study?
Now that we have noted that the results of the Trinity Study are encouraging and would let people retire early, how should we implement it?
Theoretically, the Trinity Study is based on a simple concept: you can retire based on a large principal by withdrawing with a fixed withdrawal rate.
However, in practice, this means you need to accumulate money, more than most people accumulate during their lifetime. And you need to accumulate this earlier than retirement age.
To accumulate this money is not easy, but it is also not complicated. First, you have to save money (as much as possible). For this, you will have to focus on your expenses and earnings.
Then, you will have to invest that money until you can retire. Once you have accumulated the proper amount through capital gains and savings, you will be financially free.
If you are interested, I have many articles on my blog about financial independence.
How did I do it?
You can find my code and my data on Github. Everything is available to share as much as possible!
I wrote the entire program in C++. I used this programming language because it is my favorite! And it is blazing fast! I have not especially optimized my code, and it takes less than a second to generate thousands of simulations.
If you are not a coder, I also have an online FIRE calculator to do most of the calculations presented here.
My U.S. and international data is based on the data made available by Big ERN in its Safe Withdrawal Rate series. It is a good dataset that has been tested several times already. Big ERN made all this available for free. I am thankful for his work! I have completed its data with the missing years using the same methodology.
If you want to use the graphs in this article, please cite this article as the source of the image!
Future of the series
It was fascinating to reproduce these results. And it was very insightful as well. I have learned many things from the results. It is great to see the confirmation that the original conclusions hold for more than 50 years.
And it also shows that my withdrawal rate (3.5%) is a safe bet. I may switch to 3.75% in the future. I will have to run more simulations. It is important to choose a proper safe withdrawal rate.
Talking of simulations, I have run a few more simulations with the same idea:
- Trinity Study Results with Swiss Stocks
- Withdrawal rates and low-yield bonds
- When should you rebalance your portfolio?
- Does the Trinity Study work in recent years?
- How often should you withdraw money?
- Can you retire early with Swiss stocks and bonds?
- The Trinity results with world stocks
- Equity glidepaths in retirement
Since I plan to make more articles like these with more simulations, I would like to get your perspective on this article! Please let me know what you think in the comments below! What should I improve?
What do you think of these results? Would you like me to run more simulations like this? Do you have ideas on what kind of simulations I should run next?
Conclusions
With all these results, we can have several important conclusions.
First, the paper’s original conclusions still hold even with much more data being considered. And it still stands accurate up to 2026! It is excellent since it shows that the 4% rule of thumb still works!
If you increase the simulation time to more than 30 years, a 4% withdrawal rate is no longer safe. With 50 years of retirement, you have a 90% chance of success with a 4% withdrawal rate at most. A withdrawal rate of around 3.5% would be safer for most people.
If you want real chances of success, you will need more than 50% of your portfolio allocated to stocks. The stocks allow us to fight inflation and cover the withdrawal rate year after year.
If you choose a reasonable withdrawal rate, you will likely have much more money than when you started! For instance, a 3.5% withdrawal rate over 30 years with 100% stocks would leave you about six times more money than when you started!
For information about the original study, read my detailed article about the Trinity Study. If you are extremely conservative, you will also be interested in learning how to choose a failsafe withdrawal rate.
If you want to start investing to become financially independent, you will be interested in my guide on how to get started in the stock market.
More reading

All you need to know about the Trinity Study
The 4% Rule explained. Learn about the famous Trinity Study, how it determined safe withdrawal rates, and what it means for early retirement.
Retiring early is simple but not easy
The hard truth about FIRE. Retiring early is mathematically simple but psychologically hard. Learn why discipline matters more than high income.
Should you use a cash cushion in retirement?
Does a cash cushion help your chances of success in retirement? We find out with a ton of historical data and some simulations!
Learn easy ways to optimize your finances and save thousands in Switzerland with our exclusive e-book. Learn about the most cost-effective financial services tailored for savvy residents and expats!
Get Your FREE Swiss Money-Saving Guide
Hi,
Thanks a lot for this, always a well explained analysis!
Have I understood correctly that you use actual annual returns based on historical data?
If so, have you considered rather representing the annual returns from each year as independent normal distributions and randomly simulating from them, with a mean and standard deviation calibrated on historical data, in a “random walk” type methodology like that which underpins the Black-Scholes share option pricing formula?
Would that add any value? I wonder if you use historical data by itself, you may miss out on some possible outcomes in the far left/right tail of the distribution which could be captured by rather sampling from a probability distribution. You could then vary the parameters / distribution and recalculate the success rates and other indicators based on more optimistic/pessimistic scenarios.
It might also be useful to place more emphasis on the scenario dependent withdrawal rate, even making the withdrawal rate a function of the recent portfolio movements.
Thanks
Hi James
Yes, I only use actual returns.
True, you could simulate more extreme outcomes with such techniques. But I am not sure this is worth it because there are then so many ways to do it that I would be overwhelmed. And it’s also then much more difficult to explain it to people.
I plan to do more simulations, but I plan to keep them on historical data.
Hello,
Sorry I am still here in 2024 Oct and even asking. :) I did not find any period in the SP500 history where you would get 48k USD from the initial 1000, even with 0% withdrawal. The max was 19x for me between the top of the dotcom bubble and 30 years earlier. And again, with 0 withdrawal. Which period did you get this result for and what kind of equity basket?
Kristof
Apologies, I saw the start date being 1932/6 which is 4.4 and 1962/6 is like 54.6 according to my SP500 data, so less than 13x.
Hi Kristof,
Are you sure your data includes dividends (total return)? In my data, the SPX-TR index is 111085 at 1962/6 and 2036 at 1932/6, so a factor of 54 between both.
Hi Baptiste,
This is really interesting to see as an update to the Trinity Study.
One question I have is what is the dataset you have used for returns to go back to 1871? The original paper uses data from 1926 onwards (earliest date available for S&P/Long-term bonds data) so just curious what has been used to extend this.
Hi Matt
The dataset is based on the S&P500 and is the same used by Big Ern here: https://earlyretirementnow.com/
I am happy to see how active the comment section of this post continues to be, and thank you Baptiste for the very interesting updates to it.
I am lean FIRE for 3-4 years now, and while I started with a “not-very-safe” SWR of 5%, recently I’ve managed to lower that SWR to 4.5%. This is down to my expenses not having increased much (or anything at all) in the past years, in spite of inflation, while my stocks and options portfolio has been appreciating at a higher rate than that 5%. Probably at low double digit rates, though I don’t have the exact figure with me right now.
One important caveat to make is that there’s been a big rally (still ongoing) very recently. My net worth is right now at all time highs, and that makes the SWR be the aforementioned 4.5% at the moment of writing this. But as we all know, markets can drop again and lose part or all the gains attained in this recent rally.
Ideally, I also would like to have a SWR of 3.5%. Or even 4% for now, to focus on the new milestone. I’ve been thinking of getting some part time job to increase my net worth and so get to that desirable SWR faster.
Hi Amat
Thanks for sharing! And congratulations on being lean FIRE!
Be careful that what you are describing is your effective withdrawal rate not your planned withdrawal rate. This means that if tomorrow the stock markets falls by 30%, your withdrawal rate will increase significantly at the worst possible moment.
The SWR is more the one you used to plan your strategy. For instance, I am planning with 3.8%. So there will be years above that and years below that.
We’re planning fixed percentage withdrawal, because we’ll retire when we’re 40 years old. That’s 1 year from now. We withdraw 4-5% each year of the current portfolio with the floor of maybe 50k€. Our portfolio is now about 3M€ and our essential expenses are only about 30-40k€ per year so we have a lot of money for travelling, gifts to our child, hobbies and charity. Those are easy to cut. Our portfolio is 75% VWCE etf and 25% bonds and cash. We plan for a 50 year long retirement and we think that normal SWR is too risky for us, because, as I said, we can easily cut our expenses. And our calculation doesn’t include future pensions, possible part-time work for fun and our bitcoins. We also have no debt. Here’s good text from William Bernstein. http://www.efficientfrontier.com/ef/998/hell.htm
That’s the worst case scenario, but proper planning must consider also those.
Thanks for sharing your strategy!
I am not sure if I agree with Bernstein that you can withdraw 5% of your current portfolio without issues. And disregarding inflation seems unreasonable as well. I think this is riskier than a SWR based on the initial portfolio, as long as you can stick to your SWR.
My simulations on the subject seem to validate this: https://thepoorswiss.com/withdraw-current-portfolio/
On the other hand, if you have enough margin with a floor of 50k over a possible withdrawal of 150k, it may work better, but be careful about making sure that your floor is accurate.
Yea, you’re right that that’s my effective withdrawal rate. Should’ve added that in my comment.
I find the “planned” one however difficult to estimate, as life situations change. You cannot know at the start whether you’re gonna stick to a given level of expenses for the rest of your life, can you?
In any case, you can say my planned SWR is 5%, as that’s what it was at the start, aware as I was that that rate is pretty ambitious and its success in no way guaranteed. I also expected the appreciation of my net worth to increase at a faster pace than my inflation-adjusted expenses (which has been the case thus far), so one would expect to see a falling trend in the SWR over time.
But as said I don’t deny a good deal of ambition and optimism in my assumptions. After all I’m only 3-4 years into FIRE. Hence why I talked about taking a part time job for some time to bring the ship 🚢 to safer waters.
Cheers!
Hi Amat,
You are correct that the retirement expenses are difficult to estimate and stick to it.
As long as you are aware of the aggressiveness of your strategy, you are good and it seems you are ready to take measures to reign in the ship, that’s great!
3.8% much more reasonable.. 3.5% is were we are.
BUT, it also makes a difference on age. We are 61, so 35yrs is reasonable maximum.
Very useful analysis! Thanks!
I wonder, if we reduce the withdraw frequency from once per month to once per five years by taking a loan at the beginning of every five years, do we increase the chances of survival?
The idea is based on:
– Interactive Brokers can give you a loan with quite small interest rate given that the collateral are the stocks you hold with them.
– 4%/year * 5 = 20%, which is well below the initial capital at the beginning of the retirement, so it should be OK, despite a volatile market.
– The expected returns are higher that the cost of borrowing.
Perhaps, this scenario makes the most sense if someone is invested 100% in the stock market.
Hi Dimitris
It could work. But there is a major problem with that: You can’t predict the loan rates, so on 5-by-5 year basic, variations can be huge. When you get a margin loan at 0.5% or a 5%, it is going to make a major difference. You could arbitrage and only use it when the rate is good, but then it becomes even more volatile.
It could be an interesting tool when rates are really low, but could be difficult to predict.
Hi Baptiste and thanks for the reply!
Indeed, we can’t predict the loan rates. I was thinking of using historical data for that as you did for the rest of the parameters.
For a first approximation, perhaps we can even test if the idea holds any water by using an estimation like: loan rate = inflation + 0.5%.
The inherent volatility of the interest rates is something we need to live with, just as we do for the stock market, which is actually even bigger. With studies like yours we can quantify better our options.
All of this is a rough approximation anyway. Ideally, someone would borrow everyday only the money they need and pay it back after X years.
Typical loan rates are at closer to 2% over inflation.
Hi Baptiste,
Above you displayed a Worst Duration for a Simulation of 50 years – 1871-2023 chart. Do you have a Worst Duration for a Simulation of 30 years – 1871-2023 chart?
Regards,
Andrew
Hi Andrew,
No, I don’t have a chart for that.
You can use my FIRE calculator to get the same results.
Thank you for your instant reply!
If I understand the blue line correctly, with an AA of 75/25, a withdrawal rate of roughly 3,4% would sustain 600 months which means „safe“ for 50 years. It is a line which started to drop at (apparently a bit more than) 3,4%. I was wondering if an alternative line e.g. representing 80/20 or 70/30 would lead to a line which started to drop a bit further to the right?
As the „neighbouring lines“ of 100/0 and 50/50 are clearly inferior to 75/25, there apparently needs to be an AA close to 75/25 which is „best“, considering the highest withdrawal rate supported for the whole 600 months?
Hi Olaf
There is likely an optimal better than 75/25, but I did not search it.
You can find this iteratively with the Advanced FIRE Calculator
In my testing, 75/25 is better than 80/20 for periods below 50 years and then it reverts.
We see here scenarios where we lose all our money, and scenarios where we end up with 6 times our original sum or even more. I obviously don’t want to lose, but I also don’t want to end up with 6 times more – for me that would mean I could have lived a much richer life than I actually did (e.g. I could have gone on vacation more often or stayed at nicer hotels).
I would be interested in seeing simulations that examine two things:
First, changing the criteria for success to having as much money at the end as I had at the beginning (adjusted for inflation?). To me that means that if I happen to live longer than the time we calculated for, then I will still be fine.
This could also be seen a different way: for each withdrawal rate, instead of examining a specific number of years, you could show what’s the least amount of time it takes to lose everything in the worst case and the median case (probably more interesting for higher withdrawal rates)
Second, changing the withdrawal rate to a percentage of the current sum rather than a percentage of the initial sum. This could simulate someone who’s living large when the market is good but cuts back when it’s bad.
Probably the easiest way is to have two portfolio, one invested in equities and the other in fixed income.
Fixed would give you bare minimum, while equity would give you the variable.
Hi Bar
That’s a good point, even median terminal values are significantly higher than we need.
I tested with the criteria you mentioned already: How to sustain your capital in retirement?
You mention the “least amount of time it takes to lose everything”, isn’t what I did on the Worst Duration results?
And I also did test using a percentage of the current sum: Can you withdraw 4% of your current portfolio?
Furthermore, adding some inflation number to your withdrawal is very important! We all know that inflation increases the cost of everything!!
Furthermore, adding some inflation number to your withdrawal is very important! We all know that inflation increases the cost of everything!!
Loan rates closer to inflation+2%
Hi, great work, thank you.
Q – are your terminal values inflation adjusted? I.e. is a 6x growth over 30 years real, net of inflation?
Thanks
Hi CD
The terminal values are in current dollars, but the withdrawals were adjusted for inflation.
The problem that the simulation highlights is you get several years in a row of negative equity return. When you combine that with withdrawals you get into trouble quickly.
It is unlikely for this to happen, but it does occasionally. Happened to my freind who got large lump sum of $$ and then mkt crashed hard 2months later and didnt recover for 2yrs. Luckily he had another source of income (wife worked part time for 3yrs as was her plan)
Great research. Thank you very much. I mean i also can invest 380000 Euro into the S&P 500. Than thanking out 4 percent every year would not be a problem. When the market crashes or is in a bear market phase i have some savings in my cash account which i can use. So the drawdown is not realy a problem.
Keep in mind that you are taking 4% of the initial sum, not of the current sum. Depending on how many years you have in front of you, 4% may be safe, but for very long term, it may not be. And dont’ forget about the exchange rates.
Indeed, using a cash cushion can help.
Great, thanks. One more question to your last chart: An Asset allocation of 75/25 outsmarts the 100/00 and the 50/50 portfolios. Can you find out the „Optimal Asset Allocation“ for the „hightes SWR“? I suspect it to be in the area of 80/20 with a rate of maybe 3,6%?
Hi Olaf
I have never done this test, so I don’t have the code ready.
I guess it will depend on what you mean by highest SWR? Highest with 90% probability or a failsafe SWR?