All you need to know about the Trinity Study
| Updated: |
(Disclosure: Some of the links below may be affiliate links)
You have probably heard of the 4% rule if you are interested in early retirement. This rule states that if you withdraw 4% of your portfolio yearly, you can sustain your withdrawals for 30 years. But do you know where it comes from? If you have read a lot about it, you probably heard about the Trinity Study. This study is where it all started.
But do you know what the Trinity Study is? Most likely not. Many things people are saying about the Trinity Study are not correct. Many people talking about this study have not even read the original paper.
There is nothing mystical about this study. It is merely a research paper by three professors of the Trinity University. Hence the name.
And do you know that it has nothing to do with early retirement? So, why is it the cornerstone of most Early Retirement articles?
In this article, I detail this paper and what it exactly is! First, we see what is inside the Trinity Study. And also what this data shows us. And finally, we see what people get wrong when discussing the study.
The Trinity Study
As I said, the Trinity Study is a research paper from 1998. Three professors of the Trinity University wrote it, Philip L. Cooley, Carl M. Hubbard, and Daniel T. Walz. The real name of the article is “Retirement Savings: Choosing a Withdrawal Rate That Is Sustainable”.
It was only nicknamed The Trinity Study based on the university it came from. And also probably because the name of the paper is too long!
This research studies the success rates of different investment portfolios for various periods with varying withdrawal rates.
It is worth mentioning that this paper was not the first to mention the 4% rule. In fact, it started a few years earlier, in 1994, with a paper by William Bengen.
They have researched five different portfolios:
- 100% Stocks
- 75% Stocks and 25% Bonds
- 50% Stocks and 50% Bonds
- 25% Stocks and 75% Bonds
- 100% Bonds
They have researched four different periods:
- 15 years
- 20 years
- 25 years
- 30 years
They have tested withdrawal rates from 3% to 12%. The withdrawal rate is how much of your portfolio you withdraw every year.
When talking about success rates, we must define what success is. For this study, success is ending up the simulation with a positive amount of money. For instance, 1 USD is a success, like one million USD. Some people believe this is about sustaining their capital, but these are two very different success definitions.
It is essential to base the withdrawals on the initial value of your portfolio. If your portfolio grows 10% in the first year, you still withdraw the same amount as the first year. You do not increase your withdrawal amount with your portfolio. The only thing you adapt is that you index your expenses on inflation. Inflation is the only increase accounted for in the study!
Not accounting for inflation would completely change the results of the study!
The Results – Success Rates
There are several interesting results in the research paper.
They first researched the success rates over 50 years and over 70 years. We have to remember that it is an old paper from 1998. Indeed, the period that they studied was from 1926 to 1995. It has not been updated in more than 25 years.
The most exciting result for me is the inflation-adjusted success rates over the entire period. They computed the success rate for each possible period in the 70 years. Success is defined as still having money after the duration.
So, for instance, if you still have 10% of your portfolio in the end, it is considered a success.
Portfolio of 100% Stocks
The study has simulated several different withdrawal rates. A withdrawal rate is how much (in percent) of your initial portfolio you withdraw yearly.
For reference, here are the original results for a portfolio of 100% stocks
| 100% Stocks | 3% | 4% | 5% | 6% | 7% | 8% | 9% | 10% | 11% | 12% |
|---|---|---|---|---|---|---|---|---|---|---|
| 15 years | 100 | 100 | 100 | 91 | 79 | 70 | 63 | 55 | 43 | 34 |
| 20 years | 100 | 100 | 88 | 75 | 63 | 53 | 43 | 33 | 29 | 24 |
| 25 years | 100 | 100 | 87 | 70 | 59 | 46 | 35 | 30 | 26 | 20 |
| 30 years | 100 | 95 | 85 | 68 | 59 | 41 | 34 | 34 | 27 | 15 |
Or if you prefer something more visual:
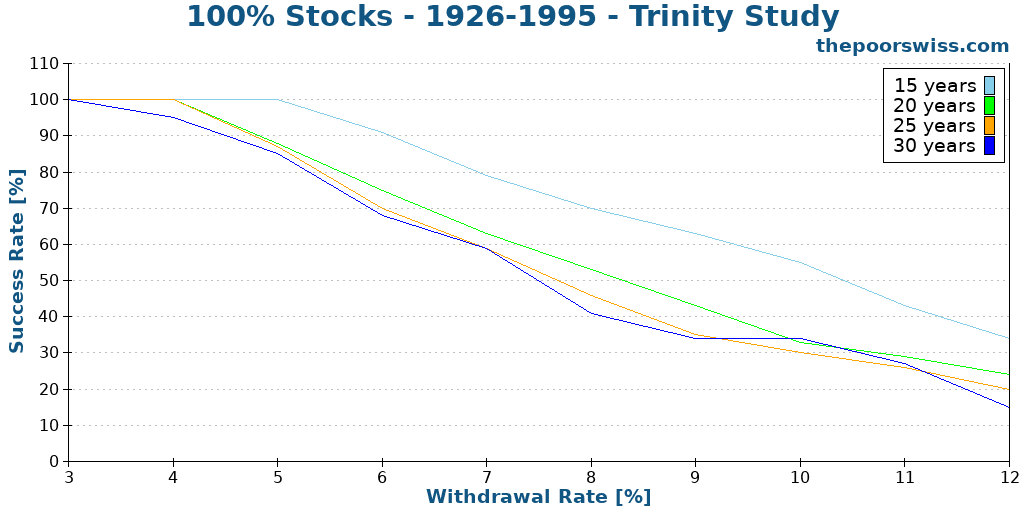
As expected, a higher withdrawal rate has a lower success rate. Indeed, a higher withdrawal rate means you are withdrawing more money every year. The 4% rule comes from the fact that even after 30 years of withdrawing 4% of your initial portfolio, the success rate is still 95%. So with that, the 4% rule was born!
We can also see that after 6%, the success rates are going down quite quickly. An 8% withdrawal rate has less than a 50% chance of success. Nobody should gamble their retirement on such a high withdrawal rate.
On the other hand, in a short-term case of 15 years, 8% still have a 70% chance of success. It is more than I thought.
Portfolio of 100% Bonds
We can also see what happens when we only have bonds:
| 100% Bonds | 3% | 4% | 5% | 6% | 7% | 8% | 9% | 10% | 11% | 12% |
|---|---|---|---|---|---|---|---|---|---|---|
| 15 years | 100 | 100 | 100 | 71 | 39 | 21 | 18 | 16 | 14 | 9 |
| 20 years | 100 | 90 | 47 | 20 | 14 | 12 | 10 | 2 | 0 | 0 |
| 25 years | 100 | 46 | 17 | 15 | 11 | 2 | 0 | 0 | 0 | 0 |
| 30 years | 80 | 20 | 17 | 12 | 0 | 0 | 0 | 0 | 0 | 0 |
And once again, in a nice graph:
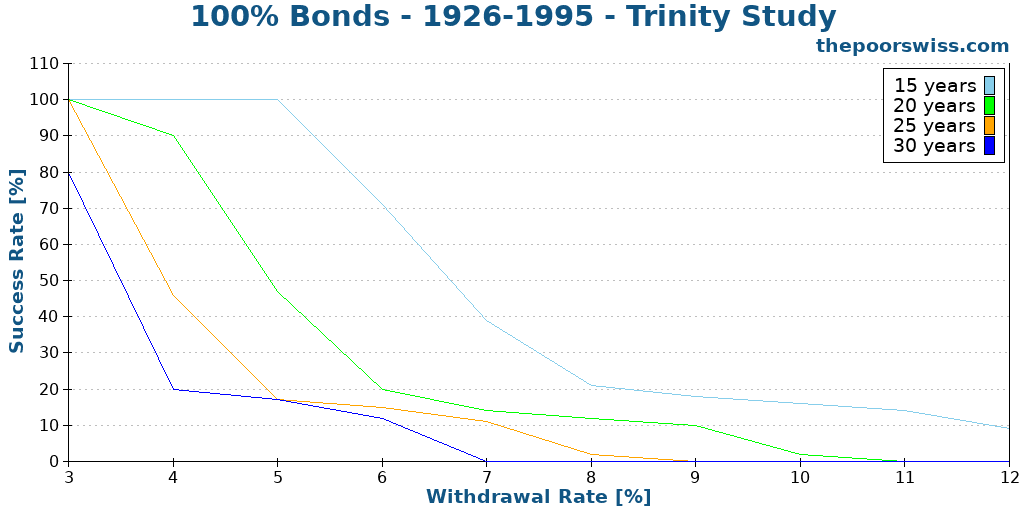
As we can see, it is much worse than a 100% stock portfolio. Even if with a 4% withdrawal rate, your chance of success is less than 25%. It is because the returns on bonds are meager. So you will withdraw more money than you are getting every year.
Moreover, while many think bonds are safer than stocks, it is not always true. Bonds can be quite volatile in some situations. The reason is that bonds are more complicated than stocks. And a lot of people overlook this complexity.
I will not show all the original results. But they are all available in the paper. Feel free to read the paper to get the details.
Comparing portfolios
I thought it would also be interesting to compare all the different portfolios directly. The study does not directly do that, but the data is available, so I did it for you!
What we are interested in is the 30 years success rate. It is the minimum duration we should be planning for. I wish the study did the test for at least 40 years.
Here are the results for each portfolio:
| Portfolio | 3% | 4% | 5% | 6% | 7% | 8% | 9% | 10% | 11% | 12% |
|---|---|---|---|---|---|---|---|---|---|---|
| 100% Stocks | 100 | 95 | 85 | 68 | 59 | 41 | 34 | 34 | 27 | 15 |
| 75% Stocks | 100 | 98 | 83 | 68 | 49 | 34 | 22 | 7 | 2 | 0 |
| 50% Stocks | 100 | 95 | 76 | 51 | 17 | 5 | 0 | 0 | 0 | 0 |
| 25% Stocks | 100 | 71 | 27 | 20 | 5 | 0 | 0 | 0 | 0 | 0 |
| 100% Bonds | 80 | 20 | 17 | 12 | 0 | 0 | 0 | 0 | 0 | 0 |
And here are the results in a graph:
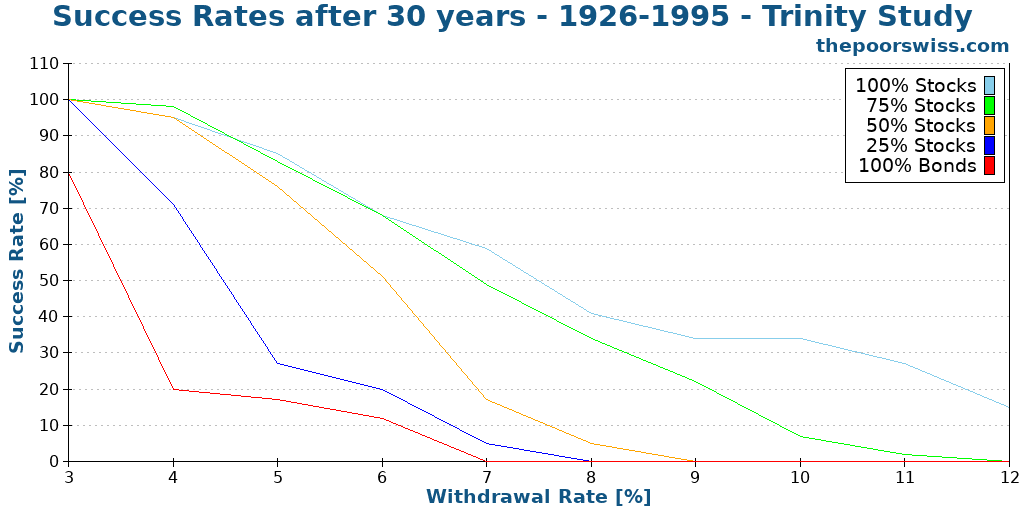
This graph is fascinating! We can see several important points.
First of all, you need stocks! You need a significant allocation to stocks to sustain your lifestyle. Unless you plan a withdrawal rate of less than 3%, you will need at least 50% stocks in your portfolio.
We can see that the two best portfolios are the 100% stock portfolio and the 75% stock portfolio. With a low withdrawal rate, there is an advantage to having 25% bonds. But if you want a higher withdrawal rate (starting from 6%), you must opt for the 100% stocks.
If your goal is a success rate of at least 75%, you can afford a 5% withdrawal rate. However, if you are more conservative and aim for a 90% success rate, you will go with a 4% withdrawal rate. Hence, the 4% rule!
The Results – Terminal Values
There is another interesting thing in the research. Indeed, the authors checked how much was the value of the portfolio after each period. These are called terminal values. This gives an excellent idea of how safe a withdrawal rate is.
The terminal value is how much money remains on the portfolio after the entire period. All portfolios start at 1000 USD. And they tried different withdrawal rates.
Unfortunately, the study only shares the terminal values of three portfolios:
- 75% of Stocks
- 50% of Stocks
- 25% of Stocks
I would have liked the results with the 100% Stocks Portfolio. But it is already interesting.
Also, these values are reported from the simulations without inflation. So, they should be compared with the results without inflation, not the inflation-adjusted results. This is a little sad since results that are not inflation-adjusted are not very valuable.
Portfolio of 75% Stocks
Here are the terminal values for a portfolio of 75% Stocks. I think this is the most interesting of the portfolio.
| 75% Stocks | 4% | 5% | 6% | 7% |
|---|---|---|---|---|
| Average | 9031 | 7367 | 5779 | 4262 |
| Minimum | 1497 | 0 | 0 | 0 |
| Median | 8515 | 6868 | 5586 | 3745 |
| Maximum | 16893 | 14980 | 13067 | 11245 |
And the same data in a graphic form:
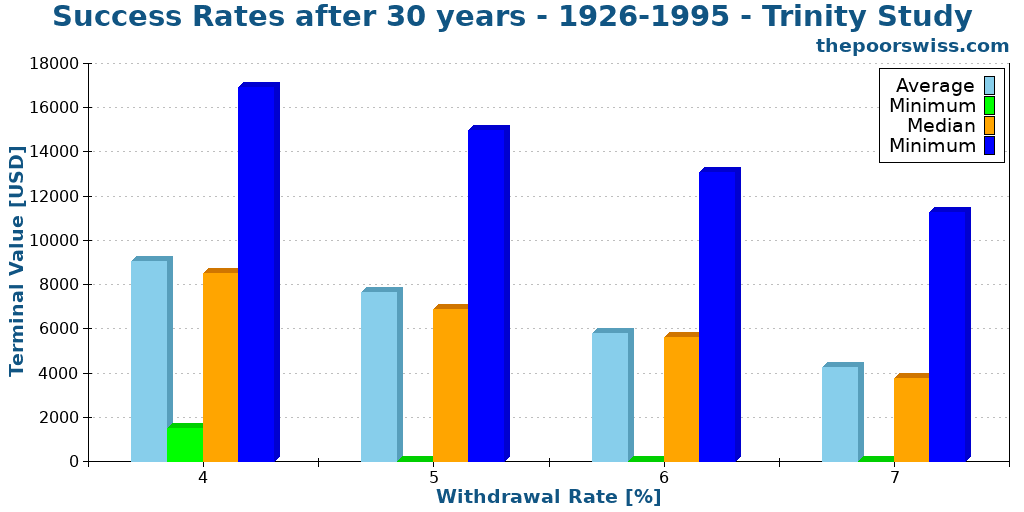
As expected, as your withdrawal rate increases, your terminal values decrease. This fact makes a lot of sense since you are withdrawing more money.
Interestingly, with this portfolio and the 4% withdrawal rate, the minimum terminal value is still higher than the initial value. That means you will have made 40% over 30 years in the worst case while not investing anything! I think this is already pretty nice.
And the maximum terminal values are really impressive. In the best case, with a 4% withdrawal, you will end with almost 19’000 USD. This terminal value is incredible, considering you live out of your portfolio.
And even with a high withdrawal rate of 7%, the average is still about 4000$. This average is still four times the initial value. A great result already. On the other hand, the minimum can be zero! In the case of zero, you end up in a bad situation where you cannot sustain your lifestyle anymore.
On average, even after 30 years, you still have a lot of money. It means you can probably sustain this forever in the right conditions.
The Conclusions of the study
The paper finishes with several interesting conclusions, as every good article should finish!
First, it should be evident if your portfolio needs to sustain your lifestyle for a long time, you need a lower withdrawal rate. Reducing your withdrawal rate will increase your success rate. You will not be able to sustain a 10% withdrawal rate for more than 20 years.
Second, bonds help increase the certainty of success for low to average withdrawal rates. But they are significantly reducing the returns of your portfolio. So, bonds are not helping when you use higher withdrawal rates. But they will likely decrease the volatility of your portfolio. Thus, bonds could help against sequences of returns risk.
Then, inflation makes it much more challenging to sustain your spending. If you know your lifestyle is not subject to inflation, you can use a much higher withdrawal rate. The problem with inflation is that your real withdrawal rate will increase yearly since your expenses will increase.
Finally, if you have a significant allocation to stocks in your portfolio, you can afford higher withdrawal rates. Indeed, you are even likely to end up with much more money than what you started with. This is interesting if you plan on giving away a lot of money to your heirs (or to charity) at your passing.
Once you know your target withdrawal rate, you can compute your Financial Independence (FI) Ratio.
Misconceptions about the Trinity Study
Several things I have read about the Trinity Study are wrong. I want to dispel some of these misconceptions.
First, The Trinity Study has nothing to do with early retirement! The authors made it with standard retirement in mind. It is why they have not studied any success rates after more than 30 years. So, if you plan to retire in your 30s, you must plan for more than 30 years!
More important, the Trinity study does not say that your money will last forever! Many people believe that the 4% rule from the study means that they can sustain their net worth forever. But this is not what the study is about.
The Trinity Study did not study the success rate of sustaining your lifestyle forever. They only tested if there was something left after some duration of time. If you have 1000 USD out of one million after 30 years, it still counts as a success from the study point of view. Moreover, it is just a success rate.
Also, many people seem to ignore that the Trinity study is over 20 years old! This age does not mean it is wrong, of course. But this needs to be taken into account.
One thing we also need to consider is that Trinity is only using the S&P 500 index. It does not apply to any stock market index. It will work very well in a broad U.S. index. But this also means we cannot extrapolate the results for any country. For other stock market indexes, we need to rerun the experiments.
Nobody is talking about the terminal values of the portfolios. People say they can sustain it for 30 years. But after 30 years, you will likely have much more money than when you started. This result is significant. Because this goes to show that you could sustain it longer, and this also goes to show that you could have used a higher withdrawal rate than you thought.
Finally, many people cite the 4% rule regardless of the portfolio they plan to use. Indeed, the study only shows success rates higher than 90% for a portfolio with at least 50% stocks. For instance, a portfolio with 100% bonds has a 20% chance of success only!
If you have another portfolio, you must run the simulations yourself. If you are interested, I have done many more simulations and provided a calculator. See the next section.
Updated Results
The most significant issue with the Trinity Study is that it is quite dated.
Fortunately, we now have more recent data from the stock market. So we can rerun the simulations. And since I like to code, I decided to do it myself.
I have collected stock market data from 1871 to 2021 and reran the experiments. You can read the updated results of the Trinity Study for 2020. We see if the Trinity Study holds for more extended simulation periods.
And if you want to do some simulations yourself, I have made a Trinity Study calculator for you.
More Simulations
I have also done some other simulations with this wealth of data:
- Rebalancing in retirement
- The Trinity Study in recent years
- Retirement with Swiss Stocks
- The Trinity Study and Low-Yields
If you have an idea for other simulations, let me know!
FAQ
What is the Trinity Study?
The Trinity Study is a 1998 research paper by three professors of the Trinity University. Its original name is Retirement Savings: Choosing a sustainable withdrawal rate. It shows that with a withdrawal rate of 4%, one could sustain a lifestyle for 30 years.
What is the 4% Rule?
The 4% states that if you withdraw 4% of your initial portfolio every year, you could sustain it for more than 30 years. It is a rule of thumb, since it depends on the portfolio and how long you need to sustain your lifestyle.
What are the shortcomings of the Trinity Study?
This study only covers up to 30 years of retirement. Thirty years is not enough for early retirees to base their plans on. Also, it is already twenty years old, and its results should be updated.
Who started the 4% rule?
William Bengen proposed this rule in 1994, in his paper “Determining Withdrawal Rates Using Historical Data”. But it was later made popular by the so-called Trinity Study paper, in 1998.
Conclusion
The Trinity Study is an excellent research work with many great results. But a lot of people take it out of context. And many people consider this study as the holy grail or the bible. But it is just a research paper!
As we saw, there are many things that people get wrong about this paper. And I think it is essential to put everything back in perspective.
Most important of all, the study was never about early retirement. It was about standard retirement with up to 30 years to sustain expenses.
Also, it is not about sustaining money forever. It is about the success rates (probabilities only!) of sustaining during a set amount of time.
Now, this does not mean it is not a great study! On the contrary, the Trinity Study is fascinating. And the 4% rule can indeed be derived as an excellent withdrawal rate that can sustain your portfolio for at least 30 years and probably longer. And we can get inspiration from this study for early retirement!
If you want to learn more about this study, I invite you to read the paper. It is really interesting. And to learn more, you should read about my updated trinity study results.
I have already talked a lot about Financial Independence on this blog. To learn more, you can read about compelling reasons to become Financially Independent.
Did you know about the Trinity Study? What do you think about this study?
More reading

Sequence of Returns Risk can ruin your retirement
Protect your retirement. Learn what Sequence of Returns Risk is and how a market crash early in retirement can destroy your portfolio.
How to implement the Trinity study in 2026
Apply the 4% Rule. Practical steps to implement the findings of the Trinity Study in your own retirement plan and withdraw funds safely.
Some extra income in retirement goes a long way
Planning to retire early and looking to increase your chances? Would income in retirement help your chances of success? We do the test!
Learn easy ways to optimize your finances and save thousands in Switzerland with our exclusive e-book. Learn about the most cost-effective financial services tailored for savvy residents and expats!
Get Your FREE Swiss Money-Saving Guide
Hi Baptiste,
Firstly, thanks so much for this highly informative post!
I have been wondering what your thoughts are on the 90/10 (10 cash or short-term treasuries) “Buffett Portfolio”. It’s basically a barbell-approach, taking all risk on the stock side and zero risk on the cash side. This portfolio promises higher returns, but also has an advantage in bear markets if stocks and bonds are positively correlated (as in 2022).
I’ll link a research paper of professor Javier Estrada on the 90/10 portfolio:
https://www.fmaconferences.org/Vegas/Papers/Estrada-FMA-LV.pdf
Also, here’s a discussion of the 90/10 on SeekingAlpha: https://blog.iese.edu/jestrada/files/2019/04/SA-Buffets-Barbell.pdf
Many thanks in advance!
Hi Roberto,
I don’t really have thoughts on that. Personally, I think that if people are willing to go 90% on stocks, they may as well go 100%.
I am not saying this is a bad strategy, but this may be over-optimization.
Regarding cash vs bonds, I have done retirement simulations with cash: Can you retire with cash instead of bonds?
And it can make sense to have cash instead of bonds.
Hi Baptiste,
Thanks for your reply.
Just one more remark: cFiresim uses 0.25% for cash rates, which historically is not correct I believe (it’s been an average of 3% since 1929 I think). What cash rate did you use?
Cheers,
Roberto
Hi Roberto,
I used historical cash returns for my simulations.
Hi,
Since the success rate of 4%/30 years/75% stocks is only 98%, why the min terminal value of the same condition is not zero?
Am I missing something? Thanks.
Hi IMS,
That’s an excellent point. I don’t think you are missing anything. I have just checked the original paper again and this is the correct number from the paper. It looks like a mistake to me. The minimum cannot be higher than zero if the success rate is not 100%. I will check this again later and add a disclaimer into the article.
Seems like the calculation of terminal value is ‘NOT’ inflation-adjusted.
So Table 4 (in the paper) should be refer to Table 1, and that make sense now.
Oh, good point! It’s a bit dumb though because anything that is not inflation-adjusted is pretty much worthless!
The other critical factor most people ignore is whether the portfolio funding the 4% is taxable or tax free. It makes a huge difference. For instance I’m withdrawing half my retirement income from an IRA meaning I have to withdraw $5,000 but only receive $4,000 into my savings account as the rest is going to taxes.
Hi,
That’s a good point. Either you take into account only the net amount or you take taxes into account into your expenses when planning for retirement expenses.
Without doing that, people are going to get in trouble because they are not going to have enough to cover their expenses!
It’s only fair to give the true originator of the 4% rule credit. Financial advisor William Bengen actually did the analysis first which was reviewed/expanded four years later by the Trinity professors.
Interesting, I have never heard of Willam Bengen before, I will have to research this and update the article. Thanks for pointing that out.
I had never heard of the Trinity Study until now, but I read Bengen’s article twice. Perhaps Bengen was not in the academia and published it in a professional journal, and the three professors had not seen it when they wrote their article.
I did a little research about it, and it seems the authors of the Trinity Study were aware of it because Bengen was cited in some of their works. I think that the Trinity Study paper was just more popular, that’s why we often think of it as the start of the 4% rule.
Hi,
Thanks for detailed analyzes.
From this article it’s still not clear what does it mean Withdrawal Rate(WR).
For example if we plan to have 4% WR yearly, it means that we will cut down our portfolio from 100$ to 96$ ( using these numbers just for simplicity and we are 100% in the stocks). We will have to live this year on 4$. But if the stock market falls and savings value moved from 100$ to 50$ and now we will have to extract 4% which is 2$. Can we live on this 2$ if we used to spend 4$?
This part is not clear, how can we get out 4% and don’t decrease the quality of life.
Thanks in advance,
Nikolai
Hi Nikolai,
Actually, the Withdrawal Rate is based on the initial portfolio. So, it’s always based on the 100$ in your example, you just adjust for inflation.
For instance:
* Year 1: Withdraw 4$
* Year 2: Adjust for inflation (1%), withdraw 4.04$
* Year 3: Adjust for inflation (2%), withdraw 4.0804
And so on. The withdrawal rate is not based on the current value of your portfolio, but on the initial value of the portfolio.
Thanks for stopping by!
Thanks for the prompt answer.
It’s great, than if my portfolio is falling by 50% I will end up getting out 4$ and will be left with 46$ on my account ( approximately, I’m not taking in account the inflation).
Still it’s questionable the period of Great Depression in the U.S.
According to statistics:
“September 1929 to June 1932
S&P 500 high: 31.86
Low: 4.4
Loss: 86.1 percent
Duration: 34 months ”
If you retire at high 31.86 and take out yearly 4% (1.28) which is almost third of your portfolio it still will last for 30 years.
Thanks,
Nikolai.
Hi Nikolai,
The Trinity Study is a matter of probability, as shown in the article. You do not have a 100% chance to succeed with all the configurations.
If you were retiring at the beginning of a bear market, you would have a high probability of running out of money.
In your article you stated you would like to see studies of longer time periods. In the June 2019 issue of the AAII Journal there is an article “Five Major Considerations for Early Retirement” by Charles Rotblut, CFA, VP of AAII (www.aaii.com) and Editor of the journal. Table 3 (pp. 22-23) “Inflation – Adjusted Portfolio Success Rates for Early Retirees (1927-2018) shows the success rates for 3% to 10% withdrawals for 35-60 year payout periods for the following portfolios: 100% stocks, 75% stocks/25% bonds, 60/40, 50/50, 40/60, 25/75 and 100% bonds. The 3% payout rate has 100% for the following portfolios across all time periods: 75/25, 60/40, and 50/50.
Hi 61,
Thanks a lot for sharing. This is very interesting. I had never heard of this article before. I will try to go through it.
In the meantime, I have updated the results of the Trinity Study in order to have longer periods!
Thanks for stopping by!
Great write up TPS! Also like the content from BIGERN, from memory 3.2-3.5% is the sweet spot
Hi InvestingHero,
Thanks :)
Yes, he has amazing content! 3.25% is a very safe bet. But it’s probably too safe. I am more aiming at 3.5% and maybe slightly higher. If you have additional protections, it could work very well.
Thanks for stopping by!
Hi,
take also a look at the SWR series of BigERN.
He computes almost every possibilities for the last century:
https://earlyretirementnow.com/safe-withdrawal-rate-series/
Hi Gdodo,
I know this series. It is really great! It’s impressive how much work he put into this!
Thanks for sharing!
Nice! Even today i’ve written about this. In my case i’m planning to reach FI along my 30s and considering that the State pension to arrive at around 65 which will give me around 30y needed. I still have to factor the loss on the state pension value since i will not be doing much contributions afterwords!
Hi Mr. Firecracker,
Yes, it’s a bit difficult to account for the state pension in this case. I am also wondering exactly how to account for this correctly. I will probably run a few simulations.
I will definitely not be able to retire in my 30s though :)
Good luck to reach FI!
Neat.
Thanks!