The 4% Rule for Swiss Stocks – Can you retire early?
| Updated: |
(Disclosure: Some of the links below may be affiliate links)
Today, we see if the 4% Rule works in Switzerland, with Swiss Stocks, or not. I have wanted to do this experiment for a very long time. Now, I got all the data I need for a complete simulation!
I have obtained data up to 1924 for Swiss Stocks and Swiss Inflation. It was not easy since not many people were interested in the data. But now, it is done! So I could finally do the simulation!
I know that many of my readers are waiting for this. And I was also waiting for these results.
The 4% Rule
The Trinity Study introduced us to the 4% Rule. If you withdraw 4% of your initial portfolio annually, you can sustain your expenses for an extended period. You will also have to adjust your withdrawal amount based on inflation every year.
Contrary to popular belief, the original study never said you could sustain your portfolio forever. The authors only simulated up to 30 years of withdrawal. But I have done several simulations for up to 60 years of retirement. And if you withdraw less than 4%, you should be able to sustain a very long early retirement.
This rule is the base of the new Financial Independence and Retire Early (FIRE) movement. We should call it the 4% Rule of Thumb. For very early retirement, 3.5% is a better withdrawal rate. On top of that, it will depend on your portfolio.
The Experiment
The issue with this study and most experiments is their focus on United States stocks and bonds. It means it is difficult to apply to other countries. Even if you invest only in United States stocks, you will still have the extra factor of the currency exchange.
I will use the same system I already used to update the results of the Trinity Study. But this time, I will focus on Swiss Stocks first. It will help us understand if we can replicate these results in Switzerland or not!
In my simulation, we are using monthly withdrawals. Each month, the portfolio’s value is updated based on the monthly returns. After that, the monthly withdrawal is updated for inflation. And then it is removed from the portfolio.
For this simulation, I have not done any rebalancing. For more information, I have compared different rebalancing methodologies for retirement.
I am using the data for Swiss Stocks from 1924 to 2019. It is as much data as I could find, and I think it is already an excellent period to see if the 4% Rule works in Switzerland.
2023 Update: I have improved the data, including bonds. This leads to better results for Swiss Stocks and Bonds and early retirement.
The 4% Rule with Swiss Stocks
First, I will consider a portfolio entirely made of Swiss Stocks. I want to see how they compare with United States stocks.
Since this is the first time I am experimenting with the 4% Rule on this data, I will start with a short period and then increase it by ten years by ten years.
Retirement of 10 Years
We can see if Swiss Stocks can hold for ten years with different withdrawal rates.
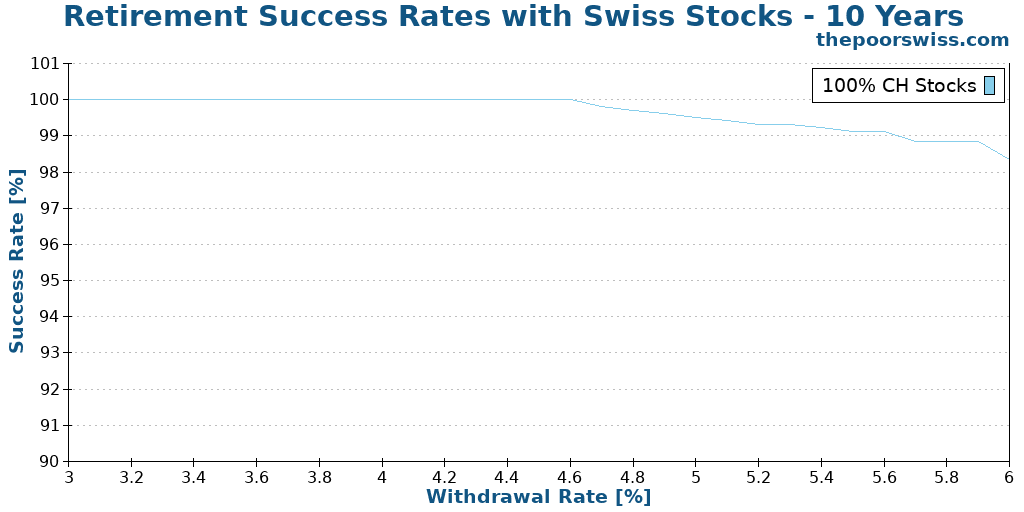
As expected, with a ten years time frame, it is almost impossible to fail. Nearly every portfolio will sustain this.
But it is interesting to note that with a 5% withdrawal rate, it is already possible to fail. It is unexpected. Over ten years, a 5% withdrawal should withdraw more than half of the value. It means there are periods when a Swiss portfolio would not even sustain ten years of retirement. It is not the case with U.S. Stocks.
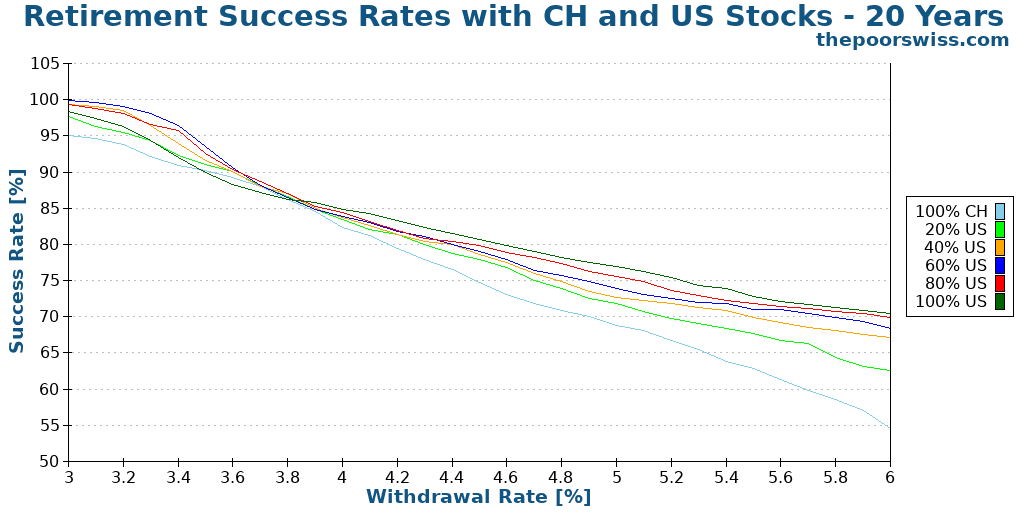
Retirement of 20 Years
Next, we see what happens with 20 years of retirement. It is already a good period to test the 4% rule. Without any returns and reasonable inflation, this would already withdraw the entire portfolio. So we already need some returns to sustain 20 years.
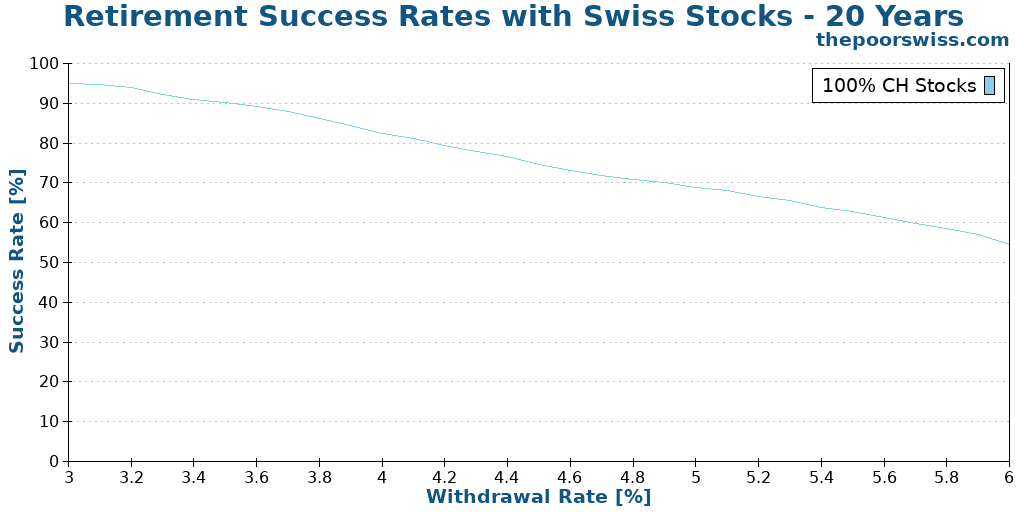
This time, the results were not nearly as good as I expected. A 4% withdrawal rate only gives you 82% chance of success for 20 years! If you want more than a 90% chance of success, you must use a 3.5% withdrawal rate.
Retirement of 30 Years
So far, this is worse than I expected. But here is what happens with 30 years.
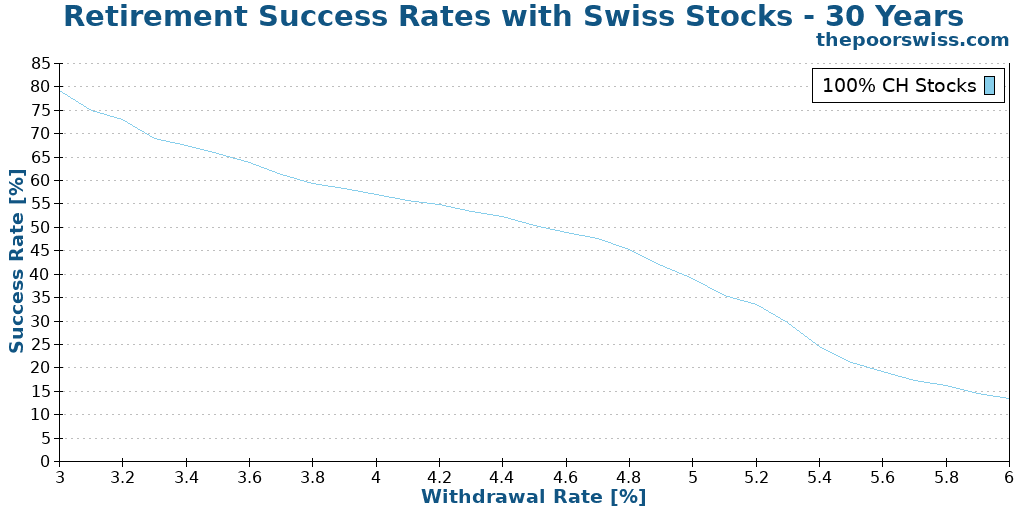
Sustaining a 30 years retirement with Swiss stocks is difficult. A 3% withdrawal rate would only give you an 80% chance of success. With the standard 4% rule, you will already be lower than 60%. You have just a little more chance of success than flipping a coin.
Swiss Stocks and the 4% Rule
We can already draw the first conclusion: Swiss stocks do not generate enough returns on their own to sustain a long retirement. You must get a very low withdrawal rate for this to work. And this means you would have to accumulate a substantial amount of money.
The second interesting fact from this data is that Swiss Stocks have done much better in recent years than before. They have been pretty flat until 1950. Thereafter, they have seen good results. Recently, they have done pretty well. And they are generally not as volatile as U.S. Stocks.
Diversifying our Swiss Stocks Portfolio
Generally, Swiss investors should not invest only in Swiss Stocks.
It makes sense for Americans to invest only in U.S. Stocks. Indeed, they represent half of the world’s stock market.
However, Switzerland represents about 3% of the world’s stock market. So, people in Switzerland should diversify their investments. Ideally, this would be with a World ETF. Since I do not have the data for the world stock, we will do it with U.S. Stocks.
Instead of using only Swiss Stocks, we will see different allocations of Swiss Stocks and U.S. Stocks.
But this means we have one more thing to consider: currency exchanges! In that case, we need to scale the value of the U.S. Stocks to CHF based on the exchange rate. I could find historical data for the USD/CHF exchange rate for this simulation.
Retirement of 10 Years
We start again with ten years of retirement.
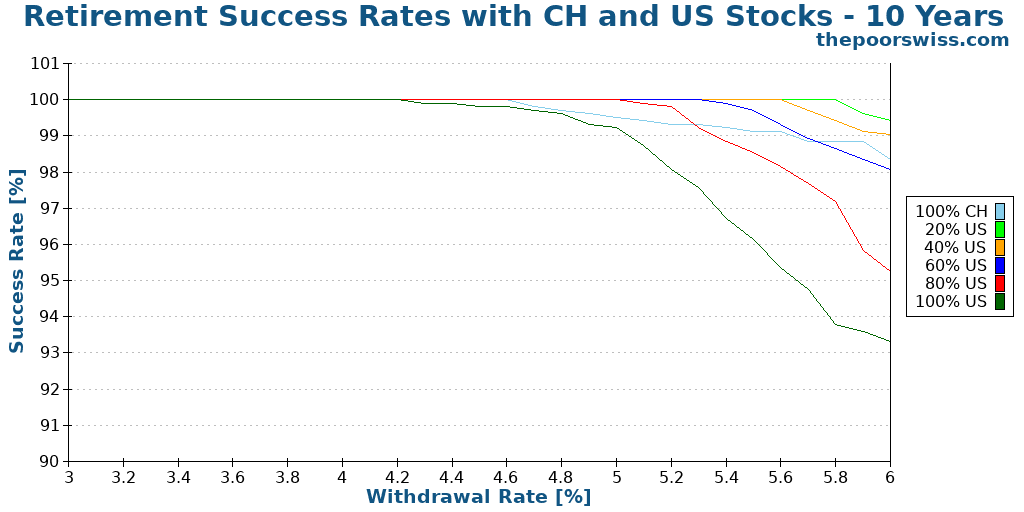
Adding some U.S. Stocks improves our chances of success. But adding too much decreases them. This situation is something I did not expect!
The 100% U.S. Stocks portfolio is the worst performing portfolio. I would have expected it to be the best. It seems that exchange rates are not as good for our portfolio.
But this is a very short period. We need to see what happens with more extended periods.
Retirement of 20 Years
So, here is what happens with 20 years of retirement.
For a high withdrawal rate, there is a significant improvement by adding some U.S. Stocks. However, for low withdrawal rates, it is not that significant, unfortunately.
Even with 100% U.S. Stocks, the chance of success for 20 years is only 84%. These results are not too bad but not too great either. And this is only 20 years. In practice, we would want to last longer than that. So what is the issue?
USD / CHF Exchange Rate
To understand the problem, we have to look at the USD / CHF Exchange rate historical data.
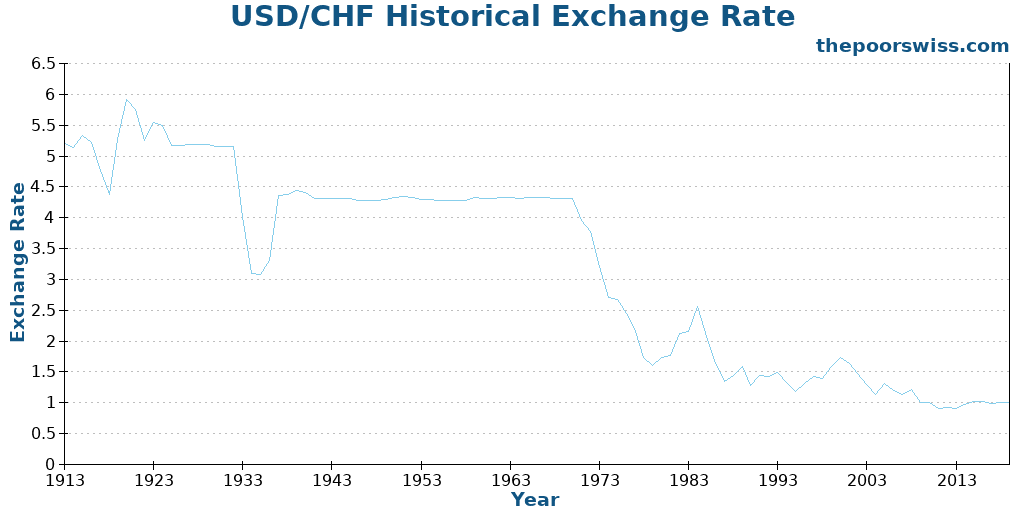
The first time I saw this graph, I was shocked. The data before 1980 is just weird. But it makes sense. To explain some of the big moves, we need to learn about U.S. dollar history.
First, since 1900, the United States dollar has been convertible to gold. This conversion is called the Gold Standard. It is essential to know this to understand this graph.
The first significant drop was at the beginning of the world war in 1914. When the United States entered the war, the dollar’s value started to recover. And after the war, it went very high since the economy rose very quickly as well.
Then, we have an almost flat graph until 1933. At this time, Franklin Roosevelt changed the gold standard. He changed the value of a dollar from 1.505 grams of gold to 0.888 grams of gold. This change explained the massive drop in the graph in 1933.
After this, we can see a very flat line. It is primarily due to the Gold Standard and a little to the Bretton Woods system. When the Bretton Woods system was abandoned in 1970, we can see a slight decline. But the colossal fall only started after Richard Nixon abandoned the Gold Standard in 1971. This action halved the value of the dollar in less than eight years.
So, why am I talking about these details? Because the data is not representative of the future. We will never see a new gold standard or a new Bretton Woods system. And we will not see huge drops as before.
So now, we have to do something bad: predict the future! In the last ten years, the dollar has been mostly stable. And in the past 30 years, it has been mostly going down. However, I do not think the dollar’s value will be cut in five ever again, or at least not in a short time. The United States has a strong economy and will remain strong for many years.
I see two ways of estimating a better dollar forecast:
- Ignoring the exchange rate by setting the same value to the dollar and the Swiss franc.
- Cutting the early crazy years and replicating the latter more reasonable years.
We will both now. Remember that the future may hold something entirely different for the dollar and the Swiss franc. I have no way of knowing better! And nobody knows better!
Ignoring the USD/CHF exchange rate
We have seen that if the exchange rate repeats its history, it will not be good for Swiss investors. We can start by seeing what happens when we ignore the exchange rate of USD/CHF. It means we set all the exchange rates to one.
Retirement of 20 Years
We start directly with a retirement of 20 years.
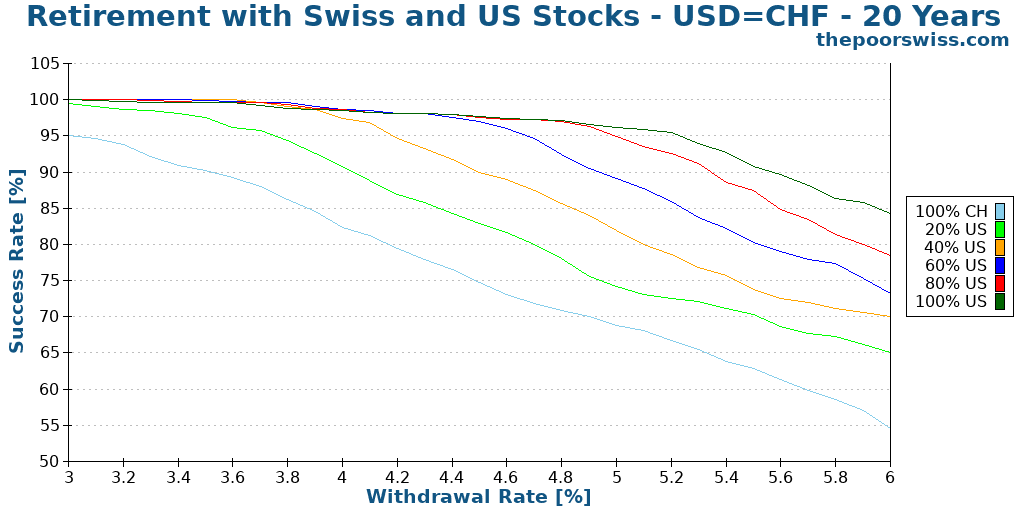
This graph is already much better! If we ignore the exchange rate, adding U.S. Stocks dramatically improves our chances of success. It is logical since they have historically had much better returns. Adding 40% of U.S. Stocks already makes a big difference.
Retirement of 30 Years
Here is what happens for 30 years.
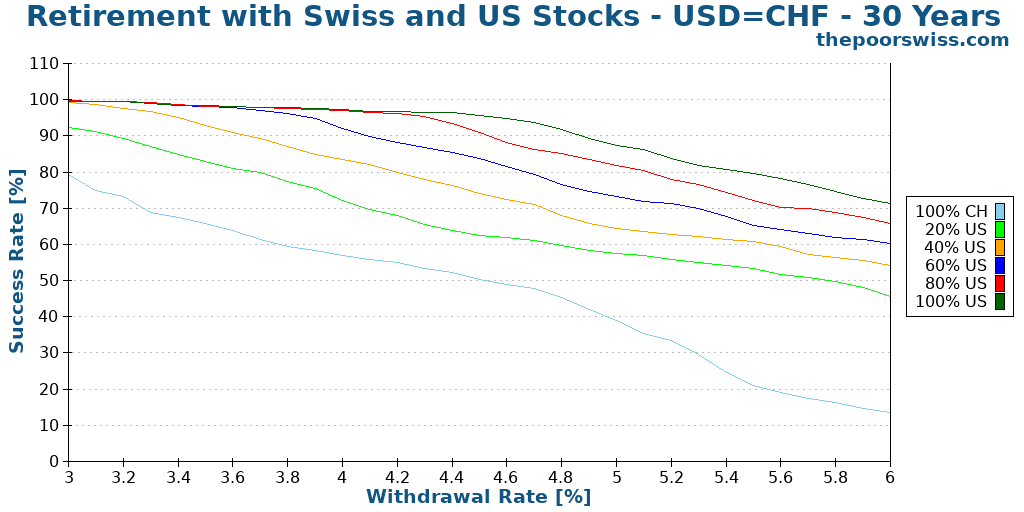
We can see that for 30 years, U.S. Stocks are necessary. To get a chance of success higher than 90% with a 4% withdrawal rate, 60% of U.S. Stocks are necessary. Swiss stocks cannot sustain a high withdrawal rate.
Retirement of 40 Years
What if we want our money to last for 40 years?
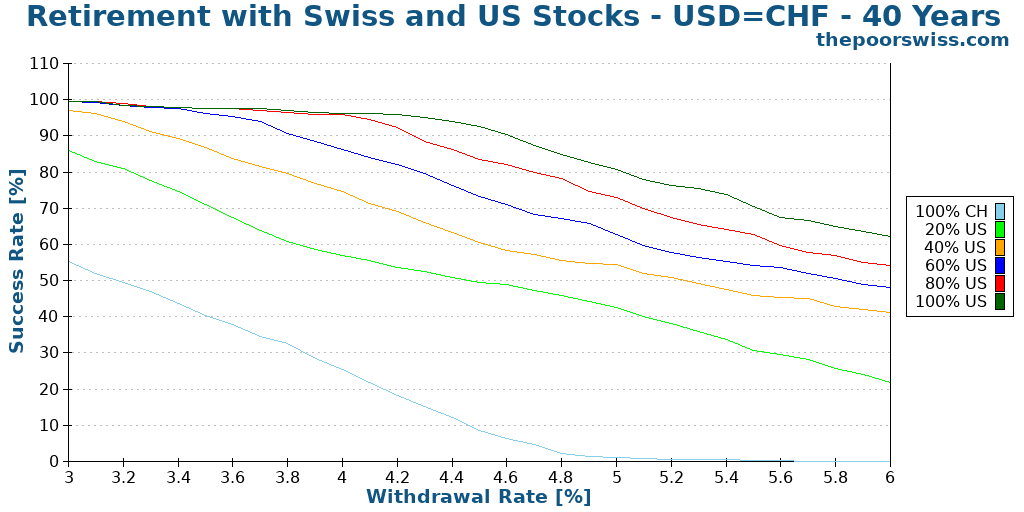
For 40 years, even with 60% of U.S. Stocks, it is starting to look dangerous at an 86% chance of success. It would still be okay with a 3.5% withdrawal rate. Interestingly, for a 4% withdrawal rate, both 20% and 0% Swiss Stocks are at almost the same performance. However, for larger withdrawal rates, the portfolio with 100% U.S. Stocks dominates more clearly.
Forecasting the USD/CHF
Setting the exchange rate to 1 CHF = 1 USD is not too bad for the short term. But it is not great at all for the long term. Also, it eliminates risks that we should not ignore. So I propose we do a small forecast based on actual returns.
Here are the composition of the estimations for the USD/CHF exchange rate:
- The data from 1978 to 2020
- The data from 2009 to 2020
- The monthly returns from 1978 to 2020 again
It is not perfect at all. And it will not turn out to be like this. But I believe that this is a much better representation of what the dollar will become in the future.
Retirement of 20 Years
We should see what would happen with our imaginary forecasted exchange rate.
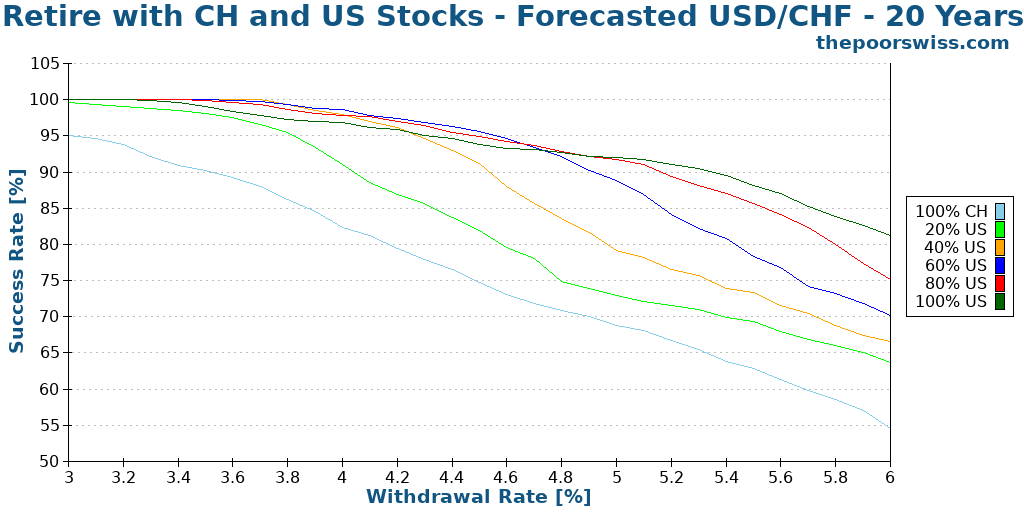
Now, the results are more interesting! We can see that there is not a clear separation with each increase in the U.S. allocation. As we expect, a too-large allocation to Swiss Stocks does not have much chance of succeeding.
But even 20% of U.S. stocks can give you an increased chance of success, up to a 90% chance of success with a 4% withdrawal rate. The most interesting is that the best chances are not with 100% U.S. but with 60% U.S. stocks. Starting at a 5% withdrawal rate, the 100% U.S. Stocks dominate, but this is too high of a withdrawal rate for most people.
Retirement of 30 years
We can also see if we can observe the same trend with 30 years of retirement.
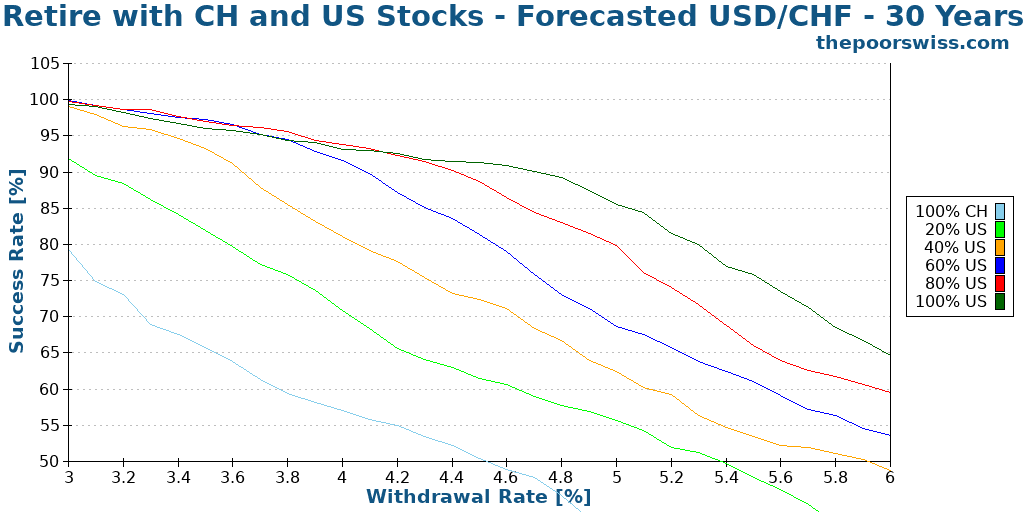
We can observe the same behavior here as before. For an extended period, you will need at least 60% of U.S. Stocks in your portfolio. Keeping some Swiss Stocks will still help your chances of success with a reasonable withdrawal rate. But this is not by a large margin.
Retirement of 40 years
Finally, we should see what happens if retirement lasts for 40 years.
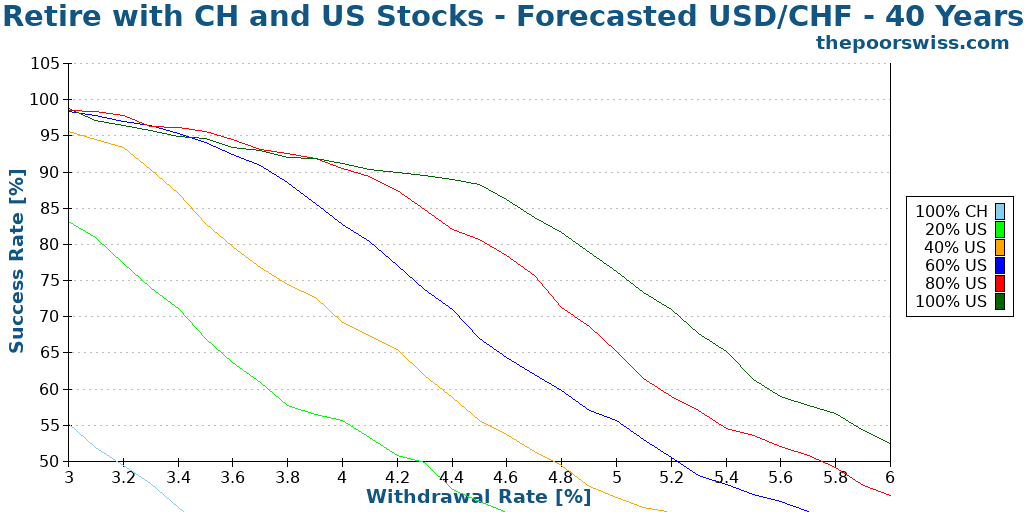
This time, the performance with 20% Swiss Stocks and 100% U.S. Stocks is almost identical except for high withdrawal rates. But we can now see a very low performance for even 40% of U.S. Stocks. If you have 60% U.S. Stocks, you will need a lower withdrawal rate to sustain.
Exchange rate conclusion
We can see that exchange rates have a substantial impact on the returns. Historically, the exchange rates for USD and CHF have been quite crazy, and I do not think we have to worry too much about it being too crazy. However, I think we still have to consider it.
20% of Swiss Stocks is a reasonable allocation to have some hedge against bad exchange rates. People using a low withdrawal rate could even consider having 40% in Swiss Stocks to hedge against exchange rate fluctuations.
The Data for Switzerland
If you want more details about the simulation, I detail the technique in my post about my FIRE calculator based on my tool and data. The source code is also available!
Swiss Stocks
For Swiss Stock values, I have gotten historical data from the HSSO. Since this data only lasted until 1995, I have completed it with SMI data from 1988 to 2020.
Here is how the Swiss Stocks have looked historically:
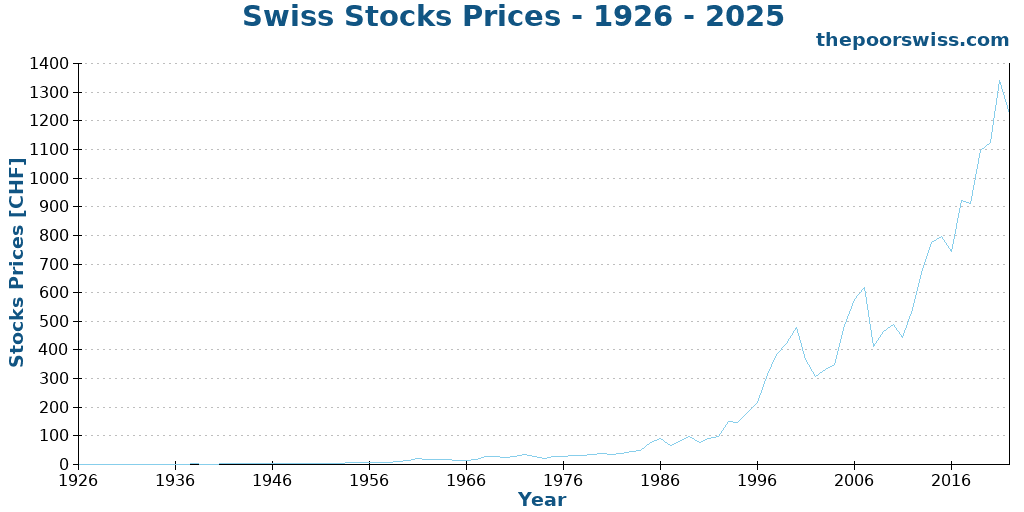
As we can see, it has not been a smooth ride for Swiss stocks. Until 1980, they were stable and returned little. After that, they started returning much more. But they have also been more volatile. They have begun looking quite similar to U.S. stocks but with a smaller magnitude.
Historical Inflation in Switzerland
For this simulation, I have gotten historical inflation data from the official statistics office. Since the index has changed several times, I have taken 1924 as the reference and computed the prices from each period based on the previous period.
Here is what prices in Switzerland look like in the last 100 years.

The last ten years have been mostly flat. Before that, inflation was much stronger. But inflation in Switzerland has always been more reasonable than in some countries.
USD/CHF Exchange Rate
I have found two sources for the historical data on the USD/CHF exchange rate. First, I found yearly data from 1924 to 2018, and I completed this with monthly data from 1971 to 2019.
We have already looked at the graph for U.S. Exchange Rate:
You can read the previous section about the USD/CHF exchange rate to learn what happened to this exchange rate.
Conclusion
From this analysis, we have learned many interesting things about Swiss Stocks and retirement in Switzerland.
First of all, Swiss Stocks alone would not have been enough to sustain a portfolio for a long time. Their returns have been too low historically to support withdrawals. However, in the last 50 years or so, they have been doing better. This fact does not prove they will do any better in the long term. But this still shows that they are going in the right direction.
Another thing we can learn is that the USD/CHF exchange rate in the last 100 years has been quite hectic. With changes in the gold standard, the Bretton Woods System, and the abandonment of the gold standard came many sharp drops and rises in the exchange rate.
This hectic exchange rate would diminish our chances of success in retiring early in Switzerland. Since the Swiss Stocks are not returning enough, we need some U.S. Stocks (or World stocks) to balance that. But then, we are exposed to currency risk.
I do not think this exchange rate is representative of the future. There is no such thing as the gold standard anymore. And I do not see a new Bretton Woods system coming back. Keep in mind that I am just making guesses.
If we consider a less volatile exchange rate, we can hope to sustain our withdrawal for 40 years. With a 4% withdrawal rate, we would need at least 80% U.S Stocks. And with a 3.5% withdrawal rate, we would need a least 60%.
After doing this simulation, I will stick with my current plan. I will keep 20% of Swiss Stocks in my portfolio, possibly increasing that to 25%. And I will keep a withdrawal rate of about 3.75% or lower. I will consider adding 5% extra Swiss Stocks to my portfolio for hedging against the currency risk. But more than that does not seem necessary.
What do you think of these results?
More reading

7 Lazy Portfolios to keep investing simple
Simplify your investing. Discover "Lazy Portfolios" that allow you to build wealth with minimal effort using low-cost index funds.
How do bonds and bond funds work?
Bonds vs Bond Funds. Learn the key differences between holding individual bonds and investing in bond funds, and which is better for your portfolio.
My Investor Policy Statement – You Need One Too!
Find out about my Investor Policy Statement and why you need one too! This statement contains my investment strategy, my asset allocation and my drawdown.
Learn easy ways to optimize your finances and save thousands in Switzerland with our exclusive e-book. Learn about the most cost-effective financial services tailored for savvy residents and expats!
Get Your FREE Swiss Money-Saving Guide
“However, I do not think the dollar’s value will be cut in five ever again, or at least not in a short time. The United States has a strong economy and will remain strong for many years.”
I tend to disagree with this statement. The US has 37T of public debt (https://usdebtclock.org) which is getting out of control. Yes, the economy is strong and I expect this will continue due to the tariffs but I don’t buy the argument that CHF hedged ETFs are too expensive and not worth it. Just my 2c :)
Thanks for sharing. I have no crystal ball, this is only what I believe. We have been hearing that the US debt was unsustainable for over a decade now, I am not sure much will change. But I think that the strong position of the US will decline over time.
Agree, I think the US will devaluate the dollar in order to cancel the debt.
My question is how the companies values will react? As they are made of assets with real values, they should increase proportionally in theory.
Hey Baptiste,
I found this resource on exchange rates
https://www.exchange-rates.org/exchange-rate-history/chf-usd-2020
would be interested if you update your calaculations with probabilities of the USD coming to 0.75. Will the dividends still cover that fluctuation?
Hi Jaz
My data already include data up to 2019. Are you suggesting to include data all the way to 2024 to improve the results? I am not sure 5 extra years will change a lot, no?
There has already been significant variations in the past.
It all depends on how much per year we lose. I am not sure dividends alone can cover the losses, but dividends and capital gains have historically covered it.
Thanks again for yet another great piece of analysis Baptiste! I would be curious if you were going to update with rates until 2025 – where currenty CHF:USD is ~1.25. How much would the further drop of the USD worth affect the model for the 30/40 years :)
Hello, Thank you for all of the wonderful work you have put into your website! I now realize that I need to include approx Swiss stocks in my portfolio. However, what happens if one does not know if they will remain in Switzerland? 2-3 years from now I may still be here, or not (where that could be I don’t yet know.) Would it still be worth investing 20 % in local stocks for possibly a short term? Thank you.
Thanks, Natalia.
Good question. In that case, you could hold 100% in World ETF and wait until you know where you will retire (/use the money) until you opt for a Home bias.
This is a great and detailed article Baptiste! I think it might be one of your best and most comprehensive. Don’t know how many views it gets proportional to your other pieces, but just wanted to say thank you for all the work you have put into this!
Thanks Andrei! It’s a tiny portion of page views, but it’s one of the article with the most work. I will soon have a new version of this article with updated data.
Hi Mr. Wicht,
Did the HSSO office data you obtained include dividends before October 1987? When I clicked on the link your provided for their website and then translated its contents to English it said what it provided was data for:
“Swiss Stock Index by Month 1924–1987 and Swiss Performance Index from October 1987 to September 1993”
which gives the implication that the data before Oct 1987 was price only rather than total return with reinvested dividends included. Obviously if one uses this data it will make Swiss equity returns look much worse from 1924 to 1987 than they actually were.
If it in fact did not include dividends where did you get the dividend info from to create a total return series?
The Pictet & Cie data (another source on Swiss stock market returns back to 1925 and through 2022) do include dividends but they are unfortunately only annual and not yearly.
Finally, why no inclusion of Swiss bonds or US bonds in the asset mixes? IIRC a 15, 20, or 25% allocation to bonds helped reduce the chances (in a worse case scenario…like a starting date of 1929 or 1966 for the US or 1962 for Switzerland) of running out of money for 20, 25, 30, and even in some cases 35 year withdrawal runs.
Thanks for any answers or replies to the above.
Sincerely,
Jim D.
Hi James,
I believe dividends are included. The change in 1987 is related to the creation of the Swiss Performance Index (SPI) (just the name of the index, not related to performance) that did not exist before, so they just changed indexes, not benchmark.
The reason for not including Swiss bonds was simply because I could not find monthly historical data for Swiss bonds that would be monthly. The problem with these simulations is finding the data :)
Hi Baptiste,
I am not sure about that (dividends being included in the HSSO data). In fact, I have reason to believe they are NOT included….which is as follows:
Please look at the annual return data from Pictet & Cie (to get this see https://www.pictet.com/content/dam/www/documents/publications/shares-and-bonds-in-switzerland/2023/Performance-Of-Swiss-Equities-and-Bonds-EN-2023.pdf or just go to https://www.pictet.com/us/en/corporate-news/historical-performance-shares-bonds-in-switzerland and then click on the February 2023 study link for the most recent version). Notice the annual returns provided in the column titled “Nominal Shares – Performance”. I can confirm this study does in fact include reinvested dividend income (in fact, the study itself even says so at the top of the page where it states “Time series (Dec. 1926 = 100), including re-invested income” ).
Now download the Excel file from the HSSO website ( https://hsso.ch/get/O.19.xlsx ) and divide column M’s data (column M will be the column headed “XII” in the row titled Jahre or Annee; column M is the value for the index as of December) for one year by column M’s data for the previous year (for instance, divide the number in, say, cell M45 by the number in cell M44 for 1962’s data) and the subtract 1 from it to get that year’s positive (or negative, in the case of a loss) return.
When you do this you will notice that no year has a greater value than the equivalent year from the Pictet and Cie data but instead that in virtually EVERY SINGLE YEAR it is lower by anywhere from maybe 2.2% or 2.3% all the way up to 10 or 11%. To me this clearly shows that the HSSO data is price only; this is why for a given year it shows a lower return (or in the case of losing years a larger loss) than the Pictet and Cie data show.
If you want I can explain a (admittedly sightly crude) method for determine monthly total returns from the annual total return data from Pictet & Cie and the monthly index numbers from the HSSO. This will make your Swiss SWR study more accurate.
PS – I might also know of a data set for Swiss bond returns as well…let me see what I can find from my notes/data/files
Thanks,
Jim
Thanks for sharing these details. I don’t have time to go through all that at this time, but I would agree that having almost alwayst the same difference is a good indication of the missing dividends.
It’s now on my TODO list to go through all that again. I guess we can do a crude pass around the results by assuming constant dividends. It’s not great at all, but it could indeed help.
Let me know if you have more data on bonds, I could run an extra simulation once I have more time.
Thanks!
Thanks so many times, Jim!
I also thought there is something odd about the pre-1987 data that the website owner presented. The dividend not being included offers a reasonable explanation…
I just came on your post by “chance” thanks to our friend google. What a great value added article! Thanks for sharing this. I will definitely add your blog to my ressources.
Merci encore
Alexandre
Thanks for your kind words, I am glad you like it :)