Equity Glidepaths in Retirement
| Updated: |
(Disclosure: Some of the links below may be affiliate links)
On this blog, I have conducted numerous retirement simulations in which the allocation to stocks and bonds remained unchanged. However, there is a belief that modifying allocations can lead to better outcomes.
An equity glidepath is a method to change the stock allocation over time. They can be used during the accumulation and retirement phases.
This article will simulate equity glidepaths in retirement and see if this can improve our results.
Equity glidepaths
As an investor who prefers a passive approach, I avoid changing my portfolio over time. However, I have received numerous requests from my readers regarding equity glidepaths, which have piqued my interest. I am curious to explore their practical application.
An equity glidepath is a way to change your stock allocation over time. For instance, you could go from 80% stocks to 60% stocks over five years. This example would be an equity glidepath.
If this sounds familiar, this may be because you have read about target retirement funds. These funds are proposed by all major fund providers and use a decreasing stock allocation. As you reach your retirement age, your stock allocation goes down. After the target date is reached, the stock allocation will generally not change. This is an example of an equity glidepath in the accumulation phase.
The other alternative is an equity glidepath in retirement. In that case, we change the equity allocation over time after retirement. This is what I want to focus on in this article.
Bonds and stocks are both attractive in a portfolio. Stocks are great for returns, which help for the long-term results of a retirement (make it last longer). And bonds are great against volatility, which is good for fighting sequences of returns risk.
Since we are interested in early retirement, we must consider long periods, up to 50 or even 60 years. For this, we will need a significant allocation to stocks.
In theory, an increasing stock allocation would work best since it would provide long-term and short-term protection. But we will test both.
Simulations
Over time, I have made many simulations on my blog for retirement. The simulations are made following the Trinity Study.
I am using the same data as for other simulations. We will use US stock data from 1871 to 2022 and 10Y US bonds for the same periods. We use monthly returns in each case. And each simulation starts at each possible month in the retirement period.
In the present simulation, I will adapt the stock allocation monthly before the withdrawal. Each adaption will be made with a step (for instance, 0.1% per month). The step will define how fast the glidepath will go.
For this article, I had to calculate the success of several millions of simulations.
Equity glidepath to 100% stocks
We start with an equity glidepath increasing the stock allocation to 100% stocks.
The problem with glidepaths is that there is an infinity of them. You can start at any start point and any endpoint. On top of that, the step of each monthly adjustment can also be anything. So, we have to make some choices.
First, we will test simple glidepaths, from 80% stocks to 100% stocks, with different steps. We can compare that with static 80% and 100% stock allocation portfolios. We will start with 30 years of retirement.
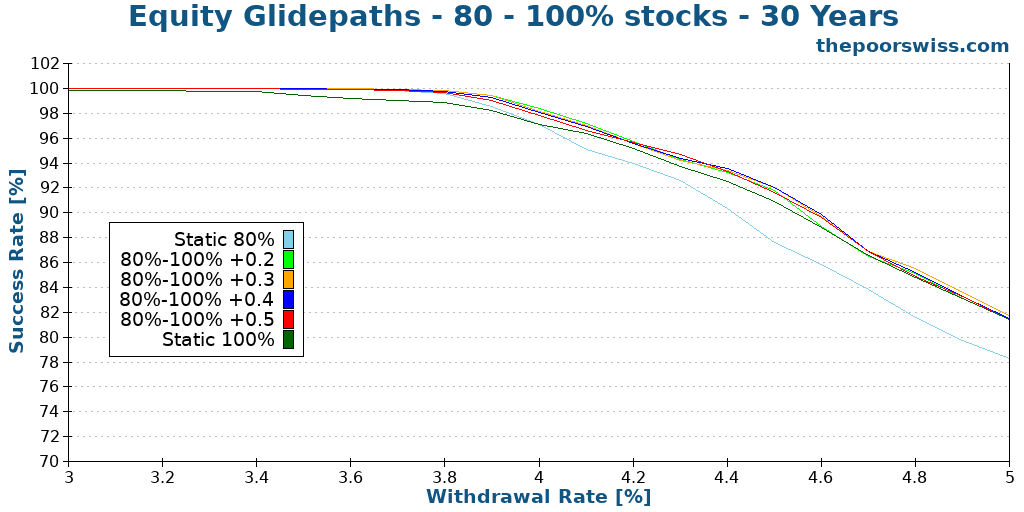
We can see several interesting things. First, a glidepath is a definite improvement over a static 80% portfolio. This allows to increase the success rate significantly. And even more interesting, a glidepath from 80% to 100% is also an improvement over a static 100% stocks portfolio.
Even over a short period, like 30 years of retirement, equity glidepaths are already interesting.
To better see the differences, we can look at the failsafe withdrawal rates of these different simulations. The failsafe withdrawal rate is the highest that would never have failed historically. I can also calculate the highest withdrawal rates for different failure rates.
| Portfolio | Failsafe | 1% | 5% | 10% | 25% |
|---|---|---|---|---|---|
| Static 80% | 3.56 | 3.86 | 4.11 | 4.41 | 5.22 |
| 80%-100% +0.2 | 3.63 | 3.94 | 4.23 | 4.57 | 5.40 |
| 80%-100% +0.3 | 3.61 | 3.93 | 4.25 | 4.59 | 5.43 |
| 80%-100% +0.4 | 3.53 | 3.92 | 4.26 | 4.59 | 5.43 |
| 80%-100% +0.5 | 3.45 | 3.91 | 4.26 | 4.58 | 5.45 |
| Static 100% | 2.84 | 3.70 | 4.21 | 4.54 | 5.47 |
Once again, these results are really interesting. We can see that an equity glidepath provides a significantly higher failsafe withdrawal rate than a static 100% portfolio. And they are also better than the fixed 80% portfolio. So you could use a higher withdrawal rate and retire earlier (since you have to accumulate less).
However, 30 years is a short retirement period if we consider early retirement and is relatively easy to achieve. Therefore, we need to see what happens with 40 years of retirement.
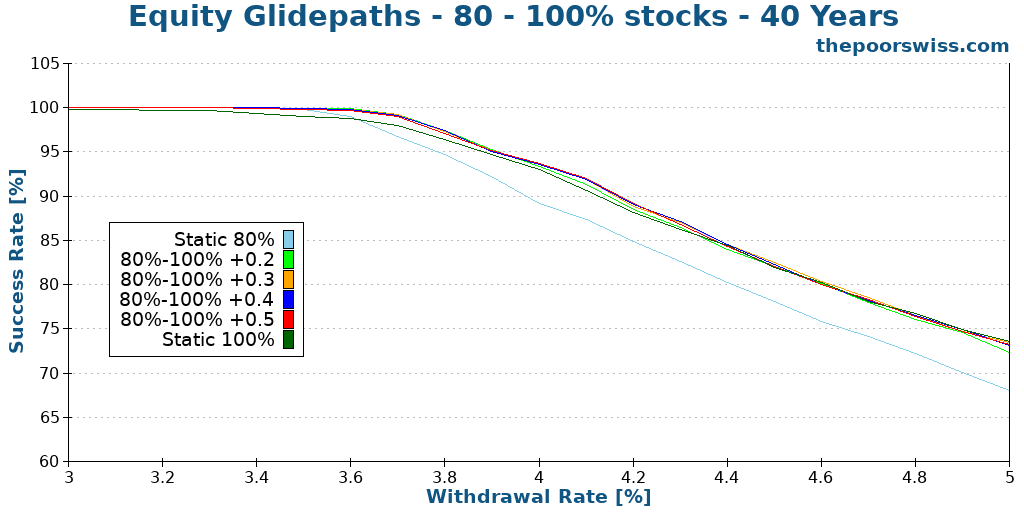
Here, we can see that the results are pretty different. First, we can observe that the static 80% stocks portfolio is already starting to lag for anything higher than 3.6% percent. So, an equity glidepath becomes an interesting improvement over the static portfolio.
Also, we can observe that the differences between the different glidepaths and the static 100% portfolio are less pronounced. We can look at the failsafe withdrawal rates now.
| Portfolio | Failsafe | 1% | 5% | 10% | 25% |
|---|---|---|---|---|---|
| Static 80% | 3.35 | 3.60 | 3.77 | 3.97 | 4.65 |
| 80%-100% +0.2 | 3.49 | 3.71 | 3.92 | 4.14 | 4.86 |
| 80%-100% +0.3 | 3.47 | 3.71 | 3.90 | 4.16 | 4.88 |
| 80%-100% +0.4 | 3.40 | 3.71 | 3.91 | 4.16 | 4.89 |
| 80%-100% +0.5 | 3.31 | 3.70 | 3.91 | 4.17 | 4.88 |
| Static 100% | 2.73 | 3.52 | 3.89 | 4.12 | 4.89 |
If you aim for a failsafe withdrawal rate, an equity glidepath will provide significant improvements. Without allowing a large failure rate, higher withdrawal rates are obtained with equity glidepaths.
Finally, we move to 50 years as our final simulation period.
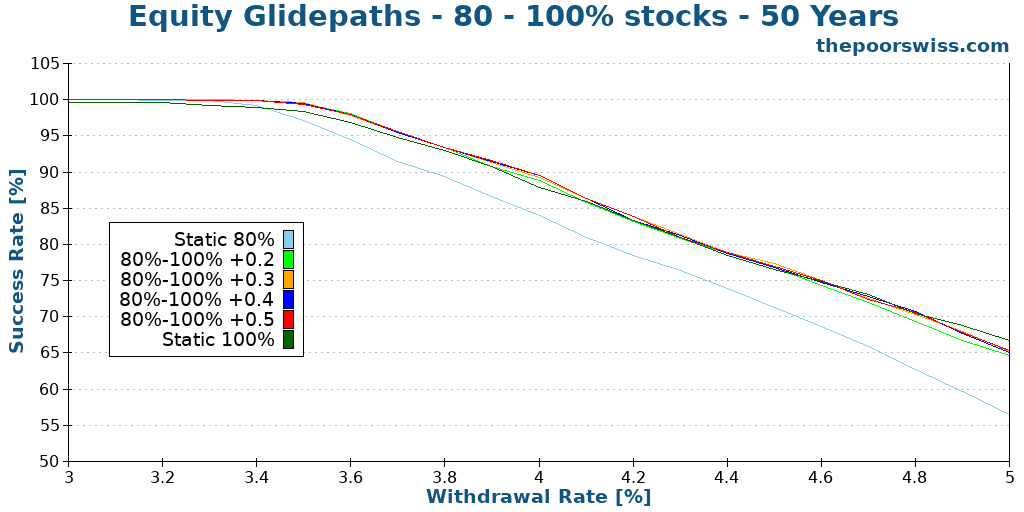
These results are very similar to the one for 40 years, but all numbers are a bit lower. We can look directly at failsafe withdrawal rates to compare them.
| Portfolio | Failsafe | 1% | 5% | 10% | 25% |
|---|---|---|---|---|---|
| Static 80% | 3.19 | 3.41 | 3.57 | 3.78 | 4.35 |
| 80%-100% +0.2 | 3.37 | 3.55 | 3.72 | 3.96 | 4.57 |
| 80%-100% +0.3 | 3.35 | 3.54 | 3.72 | 3.95 | 4.60 |
| 80%-100% +0.4 | 3.28 | 3.54 | 3.72 | 3.96 | 4.59 |
| 80%-100% +0.5 | 3.20 | 3.54 | 3.72 | 3.96 | 4.60 |
| Static 100% | 2.63 | 3.35 | 3.69 | 3.93 | 4.59 |
Interestingly, these equity glidepaths provide a significant improvement over static portfolios. With a low failure rate, these glidepaths let you withdraw more money from your portfolio.
We can also look at what happens when we start at 60% instead of starting at 80%.
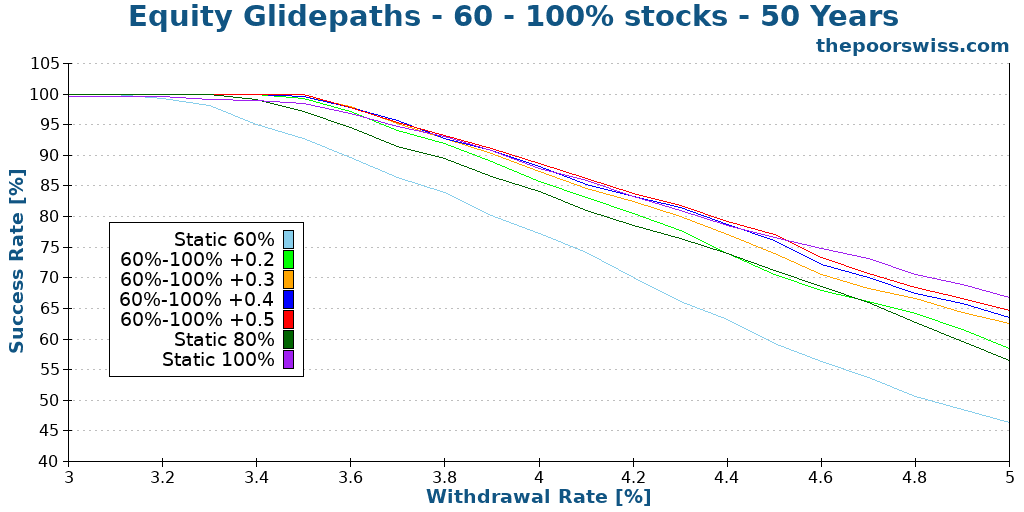
These results are much better than I expected for 60% of stocks. An equity glidepath significantly improves the performance over a static 60% stock portfolio.
We look at the failsafe withdrawal rates and compare them against the 80% starting point.
| Portfolio | Failsafe | 1% | 5% | 10% | 25% |
|---|---|---|---|---|---|
| Static 60% | 3.09 | 3.24 | 3.40 | 3.59 | 4.08 |
| 60%-100% +0.2 | 3.38 | 3.51 | 3.66 | 3.88 | 4.36 |
| 60%-100% +0.3 | 3.46 | 3.55 | 3.70 | 3.91 | 4.47 |
| 60%-100% +0.4 | 3.45 | 3.53 | 3.72 | 3.92 | 4.54 |
| 60%-100% +0.5 | 3.46 | 3.55 | 3.71 | 3.94 | 4.56 |
| Static 80% | 3.19 | 3.41 | 3.57 | 3.78 | 4.35 |
| 80%-100% +0.2 | 3.37 | 3.55 | 3.72 | 3.96 | 4.57 |
| 80%-100% +0.3 | 3.35 | 3.54 | 3.72 | 3.95 | 4.60 |
| 80%-100% +0.4 | 3.28 | 3.54 | 3.72 | 3.96 | 4.59 |
| 80%-100% +0.5 | 3.20 | 3.54 | 3.72 | 3.96 | 4.60 |
| Static 100% | 2.63 | 3.35 | 3.69 | 3.93 | 4.59 |
Again, these results are very interesting. I was not expecting a 60% starting point to be that good. A 60% to 100% glidepath performs better than the 80% to 100% glidepath in some situations, especially in failsafe.
Equity glidepath to 80% stocks
We can also test a second target, 80% stocks instead of 100% stocks. This time, we will start directly at 50 years of retirement, which is the most interesting retirement duration.
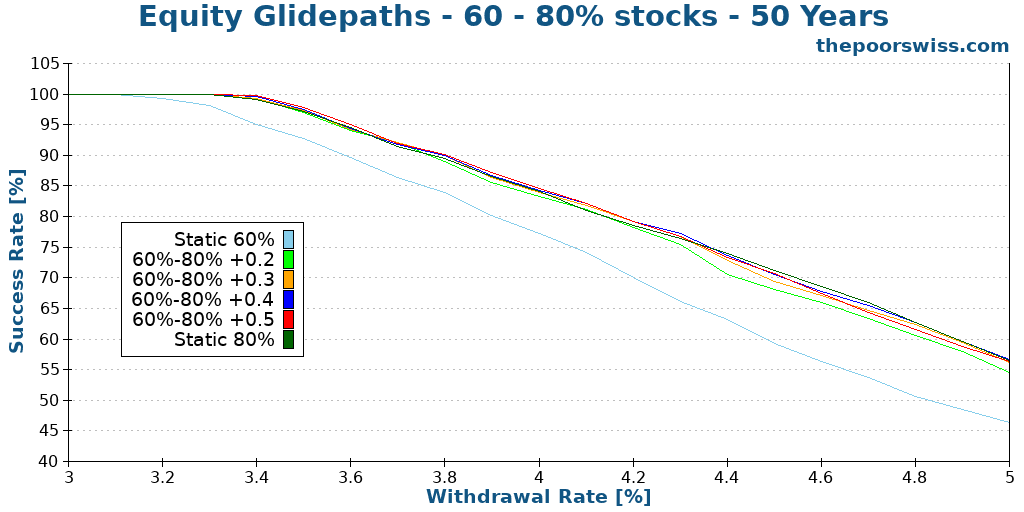
We can observe that the glidepaths significantly boost the success rate of the static 60% stocks portfolio. In some cases, by switching from a static portfolio to a glidepath, we can increase our success rate by 10%.
We can see the failsafe withdrawal rates again for these results.
| Portfolio | Failsafe | 1% | 5% | 10% | 25% |
|---|---|---|---|---|---|
| Static 60% | 3.09 | 3.24 | 3.40 | 3.59 | 4.08 |
| 60%-80% +0.2 | 3.28 | 3.42 | 3.56 | 3.77 | 4.31 |
| 60%-80% +0.3 | 3.32 | 3.42 | 3.57 | 3.79 | 4.34 |
| 60%-80% +0.4 | 3.36 | 3.41 | 3.57 | 3.79 | 4.36 |
| 60%-80% +0.5 | 3.37 | 3.44 | 3.60 | 3.80 | 4.36 |
| Static 80% | 3.19 | 3.41 | 3.57 | 3.78 | 4.35 |
These results are even better than what we observed before. Indeed, the best withdrawal rate is always obtained with an equity glidepath. On average, the best glidepath is the fastest one.
We can see what happens if we use a 40% starting point.
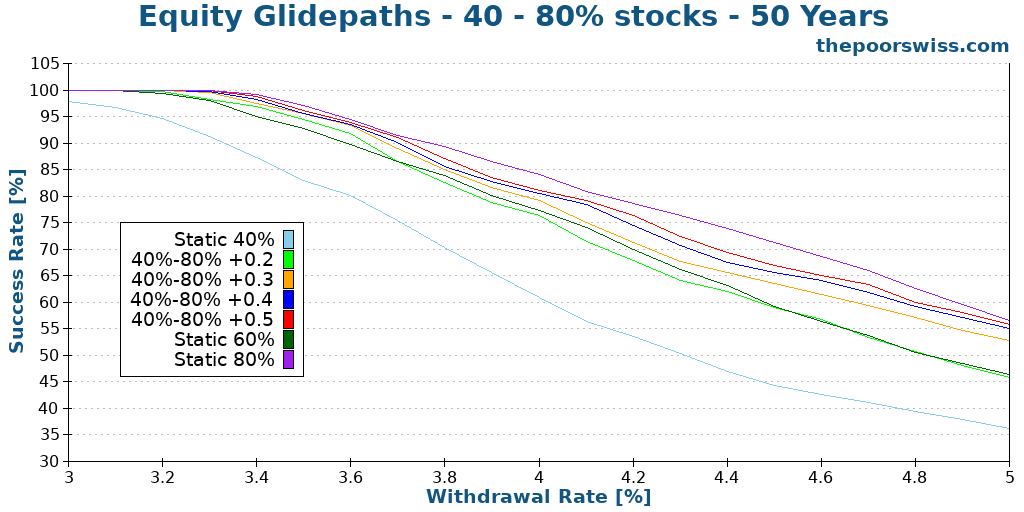
We can observe two things here. First, as we have seen in other articles, 40% is insufficient for long retirement periods. Second, equity glidepaths are always improving over the static 40% portfolio. This makes sense since this portfolio has good volatility but poor returns.
Again, we look at the failsafe withdrawal rates.
| Portfolio | Failsafe | 1% | 5% | 10% | 25% |
|---|---|---|---|---|---|
| Static 40% | 2.80 | 2.96 | 3.19 | 3.32 | 3.71 |
| 40%-80% +0.2 | 3.11 | 3.26 | 3.48 | 3.62 | 4.03 |
| 40%-80% +0.3 | 3.17 | 3.32 | 3.52 | 3.67 | 4.10 |
| 40%-80% +0.4 | 3.25 | 3.37 | 3.52 | 3.70 | 4.18 |
| 40%-80% +0.5 | 3.28 | 3.38 | 3.54 | 3.71 | 4.24 |
| Static 60% | 3.09 | 3.24 | 3.40 | 3.59 | 4.08 |
| Static 80% | 3.19 | 3.41 | 3.57 | 3.78 | 4.35 |
The equity glidepaths significantly improve the static 40% and even the static 60% portfolios. However, these results are still not great compared to the previous results. In practice, 40% of stocks are insufficient for a long early retirement.
Reverse glidepaths
We should verify our hypothesis that the glidepath should increase our stock allocation. To do that, I have also tested a few reverse equity glidepaths. The difference is that we go from 100% stocks to 80% stocks.
Here are the results for 50 years of retirement.
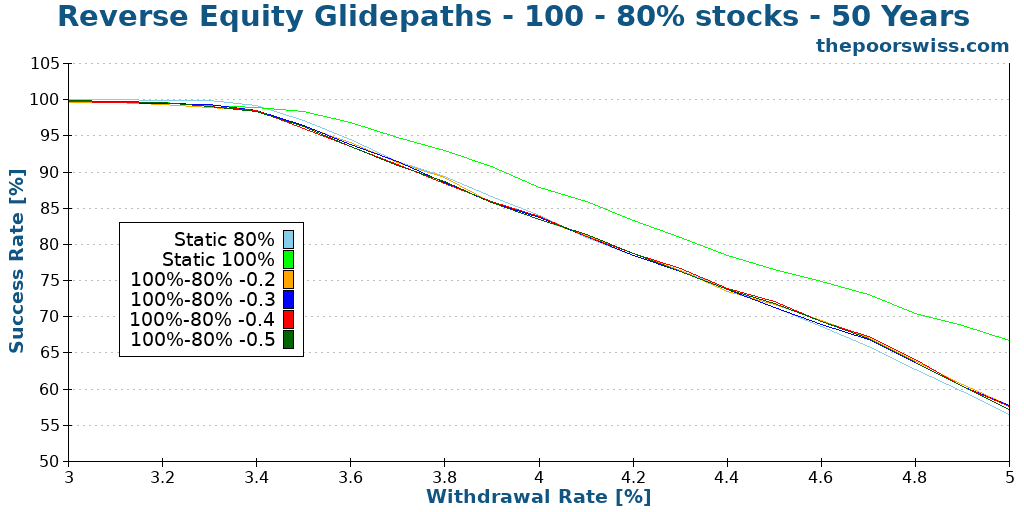
As expected, the best portfolio remains the static 100% portfolio. Adding bonds to a stock portfolio does not help in retirement. We can look at the failsafe rates again.
| Portfolio | Failsafe | 1% | 5% | 10% | 25% |
|---|---|---|---|---|---|
| Static 80% | 3.19 | 3.41 | 3.57 | 3.78 | 4.35 |
| Static 100% | 2.63 | 3.35 | 3.69 | 3.93 | 4.59 |
| 100%-80% -0.2 | 2.61 | 3.29 | 3.55 | 3.77 | 4.35 |
| 100%-80% -0.3 | 2.66 | 3.32 | 3.54 | 3.75 | 4.37 |
| 100%-80% -0.4 | 2.69 | 3.32 | 3.53 | 3.74 | 4.37 |
| 100%-80% -0.5 | 2.77 | 3.32 | 3.54 | 3.74 | 4.35 |
The equity glidepaths improve slightly over the static 100% stocks portfolio for the failsafe withdrawal rate, but they are strictly worse than the static 80% stocks. In all other cases, the static portfolios are better.
Again, this makes sense because we are using bonds for the long term while they should be used for the short term. So, reverse equity glidepaths should not be used.
Summary
Finally, we can look at all the glidepaths in a summary table and draw some conclusions.
| Portfolio | Failsafe | 1% | 5% | 10% | 25% |
|---|---|---|---|---|---|
| Static 40% | 2.80 | 2.96 | 3.19 | 3.32 | 3.71 |
| 40%-80% +0.2 | 3.11 | 3.26 | 3.48 | 3.62 | 4.03 |
| 40%-80% +0.3 | 3.17 | 3.32 | 3.52 | 3.67 | 4.10 |
| 40%-80% +0.4 | 3.25 | 3.37 | 3.52 | 3.70 | 4.18 |
| 40%-80% +0.5 | 3.28 | 3.38 | 3.54 | 3.71 | 4.24 |
| 40%-100% 0.2 | 3.15 | 3.27 | 3.52 | 3.66 | 4.09 |
| 40%-100% +0.3 | 3.27 | 3.43 | 3.60 | 3.77 | 4.16 |
| 40%-100% +0.4 | 3.35 | 3.48 | 3.65 | 3.81 | 4.27 |
| 40%-100% +0.5 | 3.43 | 3.51 | 3.65 | 3.83 | 4.35 |
| Static 60% | 3.09 | 3.24 | 3.40 | 3.59 | 4.08 |
| 60%-80% +0.2 | 3.28 | 3.42 | 3.56 | 3.77 | 4.31 |
| 60%-80% +0.3 | 3.32 | 3.42 | 3.57 | 3.79 | 4.34 |
| 60%-80% +0.4 | 3.36 | 3.41 | 3.57 | 3.79 | 4.36 |
| 60%-80% +0.5 | 3.37 | 3.44 | 3.60 | 3.80 | 4.36 |
| 60%-100% +0.2 | 3.38 | 3.51 | 3.66 | 3.88 | 4.36 |
| 60%-100% +0.3 | 3.46 | 3.55 | 3.70 | 3.91 | 4.47 |
| 60%-100% +0.4 | 3.45 | 3.53 | 3.72 | 3.92 | 4.54 |
| 60%-100% +0.5 | 3.46 | 3.55 | 3.71 | 3.94 | 4.56 |
| Static 80% | 3.19 | 3.41 | 3.57 | 3.78 | 4.35 |
| 80%-100% +0.2 | 3.37 | 3.55 | 3.72 | 3.96 | 4.57 |
| 80%-100% +0.3 | 3.35 | 3.54 | 3.72 | 3.95 | 4.60 |
| 80%-100% +0.4 | 3.28 | 3.54 | 3.72 | 3.96 | 4.59 |
| 80%-100% +0.5 | 3.20 | 3.54 | 3.72 | 3.96 | 4.60 |
| Static 100% | 2.63 | 3.35 | 3.69 | 3.93 | 4.59 |
For me, the most interesting result is that an equity glidepath is always an improvement over the static portfolio of the starting point. And it is also often an improvement over the static portfolio of the ending point.
I am surprised by the efficiency of the 60% to 100% equity glidepaths. I was not expecting them to perform that well. I was expecting 80% to 100% to be better. But they are only better if you allow higher failure rates in your planning.
If you have a significant difference between your starting and ending points, you will need a quick glidepath. In the future, I may consider more glide speeds.
Another interesting fact is that if you are interested in failsafe strategies, you can take a relatively slow glidepath. But if you allow a higher failure rate, you could take a slower glidepath.
We should also ask ourselves whether an equity glidepath is always better? Glidepaths are great when we start at a bad time. The worse times to retire are at the peaks of the market. In these cases, you want bonds to have low volatility so your portfolio will not tank too much.
But an equity glidepath will perform significantly worse than a static portfolio with more stocks when we start at a good time. The best times to retire are at the bottom of the markets. In these cases, you want a heavy stock portfolio to grow your portfolio quickly.
So, equity glidepaths are great for improving the average success rate, but they still have disadvantages in some cases. Nevertheless, if you want a safe retirement strategy, these equity glidepaths are worth considering.
Conclusion
Equity glidepaths are a great way to improve your success rate in retirement. Instead of having a fixed stock allocation, we can increase it from a starting point over time. For instance, an equity glidepath from 60% stocks to 100% stocks performs well if you want to focus on failsafe withdrawal rates.
Both bonds and stocks offer unique advantages. Bonds are an excellent option for protecting against sequences of returns risk due to their lower volatility. Meanwhile, stocks can help prevent running out of money with higher returns. Therefore, it is wise to consider relying on bonds in the early years when sequences of returns risk are a concern, while stocks may be more beneficial in later years to ensure the longevity of your portfolio.
As a result, it makes a lot of sense to start with bonds and slowly decrease their allocation. That way, bonds, and stocks are doing what they are best at. As a result, we get better success rates and could use a higher withdrawal rate for the same target failure rate.
People considering retiring with a fixed allocation to bonds should highly consider an equity glidepath. This will likely result in safer retirement.
These results make me reconsider my 100% stock portfolio in retirement. This portfolio is excellent for the accumulation phase but may be suboptimal in retirement. I will have to think about this more.
Interestingly, we can also do a simpler glidepath by only selling bonds in retirement. This way we will have a glidepath where the bonds part will slowly disappear, and then we will be left with stocks only. And if you like having dynamic parameters in retirement, you may like dynamic withdrawal rates.
Are you planning to retire with bonds? Are you considering an equity glidepath?
If you are interested in the subject, I could run more experiments on equity glidepaths because there are more parameters to explore.
More reading

Financial Freedom – Book Review
Financial Freedom relates the story of how Grant Sabatier reached Financial Independence in 5 years. Find out what I thought of this book.
Not All Assets are Created Equal – Introducing the FI Net Worth
What counts for FIRE? Learn why your "FI Net Worth" is different from your total net worth and which assets you should exclude from your calculations.
All you need to know about the Trinity Study
The 4% Rule explained. Learn about the famous Trinity Study, how it determined safe withdrawal rates, and what it means for early retirement.
Learn easy ways to optimize your finances and save thousands in Switzerland with our exclusive e-book. Learn about the most cost-effective financial services tailored for savvy residents and expats!
Get Your FREE Swiss Money-Saving Guide
Hello,
There is a simpler “glidepath” method that I have been curious to see calculated, but it doesn’t appear in any calculator and I don’t have the technical skills to calculate this myself.
The idea is, basically, don’t do any rebalancing or calculating or anything else; simply draw your spending from bonds only, until you run out, and only then start selling stocks. I think this works out to be around -0.25 monthly change, if I understand correctly how you calculate speed, though the actual rate would change depending on starting year and on how bonds happen to be doing in your first years.
This method might not be the mathematical ideal, but it is super simple, and since we like simplicity here, it might be worth looking into.
What do you think?
Hi Bar,
I think this is a great and simple idea. If you start with 80/20 and only sell bonds, you will end up with 100% stocks eventually, and you will have achieved something similar to a glidepath.
I don’t know if it’s better, but at least, it’s simpler. And the speed should be more or less relative to the withdrawal rate, at least in early months. After that, it will vary.
I will try to do some computations in the future and see how this compares with an equity glidepath.
Thanks for sharing your idea!
Hi Baptiste,
Did you watch the latest Ben Felix’s video on sequence of returns risk?
https://m.youtube.com/watch?v=QGzgsSXdPjo&list=LL&index=2&pp=gAQBiAQB
In this video, Ben says that a static 100% stocks allocation is actually the safest strategy, outperforming even rising equity glides.
What do you think?
Hi David
I did not watch yet, but I should. The conclusions seem really interesting. It looks like he is advising spending adjustment to avoid bad sequence of returns.
The differences between his results are mine may be due to the data used. In my case, glidepaths performed significantly better for failsafe.
I will watch this soon!
I have watched the video. I found the part about comparing static and equity glidepaths a little limited. I would have preferred he spent a little longer or have a write-up of the details of what was done.
On the other hand, I really liked the fact he suggested to fight sequence of returns risk with flexible spending rather than changing asset allocation. I want to try his method in the future.
Ben Felix just posted a full video on this study, a must watch:
https://youtu.be/-nPon8Ad_Ug?si=3-q-bXTceNGQhorS
Even excluding the US high historic returns, it says that the optimal approach be static 100% stock allocation!
Thanks, it’s on my watch later list, it sounds interesting!
Hi Baptiste,
thanks for the very good post.
Have you considered going from 80% (or 60%) to 100% equity with a simple bond liquidation?
At the beginning of each month, just sell only from bonds to meet your withdrawal rate, without rebalancing. After a while you don’t have any bonds and then you sell stocks for a living.
This is a very simple strategy and very easy to execute. Since there is no rebalancing, transaction costs should be lower, as well as tax implications.
Another idea could be to take out of stocks if they are close to all time high (eg less than 5% from ATH), otherwise sell out of bonds. No rebalancing.
Would it be possible to run those simulations and see safe withdrawal rates for them?
Best Regards
Petar
Hi Petar,
No, I have not done this simulation. But it’s a good idea. It makes sense in terms of fees because there will not be any rebalancing. But it may take a while.
This could be a nice implementation of an equity glidepath, by simply selling all bonds until we reach 100% stocks and then start selling stocks.
I will think about doing more simulations of the sort!
I have never done any simulation based on price. The problem is that you cannot know where is the ATH in the future. In the simulation, it’s simple, but in practice, it’s impossible.
Regarding “The problem is that you cannot know where is the ATH in the future”
At the beggining of the month, when you have to decide to sell stock or bond, compare current stock price with all time high price achieved so far, so you look backward. There is no need to know anything from the future.
If you have only one equity ETF, tracking an index, that should be easy (and in your simulation you are using some US index, probably extended S&P 500, right?).
If your equity portfolio consists of several ETFs, again good approximation can be checking current level and previous ATH of one of the major indicies.
BR
Petar
I understand your strategy now. But it sounds too much like market timing for me :)
We can imagine it being after a crash, stocks are recovering back to their ATH, but historically, they have then pushed to a new ATH and that’s the one we are interested in. Since stocks go up faster than bonds, using the previous ATH is a recipe for always selling stocks in my opinion.
Hi Baptiste – awesome work, thanks for your analysis and efforts!
If a static glidepath already improves the chances, I wonder whether a dynamic one could increase the chances of success resp. the failsafe withdrawal rate further.
As we want to be more invested in stocks when the market is down, we can react to large price drops and increase our allocation to stocks right after market declines.
One possible approach could be a “never decreasing equity” strategy:
Let’s say you have a 60/40 split, so for example 600kCHF in stocks and 400kCHF in bonds and the stock market drops by e.g. 20%. Upon rebalancing you then aim to keep the stock *amount* constant to the previous year (600kCHF). So the new allocation to stocks would be 68% (=600/880) instead of only 60%, and 32% to bonds.
So you’d profit more from rebounds after large price drops than with normal rebalancing – “rebalancing on steroids” so to say.
This approach would increase the equity percentage over time and could also be combined with a regular static glidepath.
It would also be easy to implement, the straightforward formula for the new target allocation to stocks in year 2 (“A2”) would be A2 = A1/(1+A1*r1), where r1 is the stock market return in year 1 (-0.2 in the example above). Of course it would be only applied if r<0 (no allocation change if stocks go up), and A2 being capped at 1.
Maybe you get a chance to try this, your code using C++23 is too avantgarde for my Raspberry Pi on Debian.
Hi Chris
Thanks for your kind words.
Interesting idea. The only issue I see with this is if the stock market and the bond both fall, you may quickly exhaust your bonds and end up with 100% stocks, no?
But yes, this should be fairly simple to simulate.
I have not done any of these simulations in a long time, I should get back to it.
Note that my code likely runs on Raspberry, but you will need to build the compiler from source (which takes a while on a Pi).
With yearly granularity, bonds are more likely to go up when stocks go down. For US data for example, since 1871 there have been 41 years with negative stock returns, out of those only 7 have also seen bonds going down – and only 2022 with both in the double digits. And even then, you would have to have retired before 2008 in order to reach 100% stocks after 2022.
But yes, it can go quickly if you invest right before a crash. The quickest path to 100% equity would be retirement in 1928, with only 3 years to 100% equity. But in 1933/1935 you then had stocks +53%/+47%, bonds only +2%/+4%, so probably not the worst outcome…
Second quickest path would have been 2000, with 8 years.
I managed to modify and run your code, taking into account yearly stock market changes adds 0.05 to 0.1 percentage points to the best minimum withdrawal rates. Interestingly the 60% static version then performs best for most cases (failsafe to 10% allowed failure rate).
Taking into account monthly stock market declines worsens the results.
Anyways, looking forward to further analysis on your blog! (not only on that subject)
That’s a good point about the average years up and down with bonds and stocks. And well done for running the simulation yourself!
Let me know if you have further suggestions for articles.
Great article. It sheds light into a tricky subject. And it’s great to have a counterintuitive way of moving towards 100% the older you get.
However, what does it mean when you retire and already have a 100% portfolio? You buy 20% bonds when the markets are down? Is that a strategy really? If you are in a bear market you have already unrealised losses. And yet you would ve rebalancing to 20% bonds? Interesting indeed.
Hi Eon
A glidepath is really only for people with a portfolio with less than 100% in stocks. If you plan for a 80/20 portfolio, you should probably not sell 20% of your stocks to buy bonds just before retirement. If you want to do a glidepath in retirement, you should aim to have the starting portfolio when you start. But it’s true that this does not cover how to get to your initial portfolio during the accumulation phase. In fact, some people are doing a glidepath in the accumulation phase as well, but I did not yet explore that.
Thank you Baptiste for your hard work.
I’ve seen these glidepath simulations on ERN (earlyretirementnow.com). We as Swiss investors should be cautious as US returns in CHF have been worse in the past decades, so maybe it’s prudent to lower the SWR by 0.5% to account for that (plus don’t forget wealth tax + mandatory AHV contributions in your expenses).
I have to disagree on your sentence about “you should probably not sell 20% of your stocks to buy bonds just before retirement”:
Many retire when they hit their number, which is usually after stocks went up a lot. To reduce sequence of returns risk, I think it’s better to lower the 100% stock allocation to maybe 80% (also with a glidepath) for the last 3-5 years before retirement. And after retirement, you do the glidepath back to 100%. Seems to increase SWR a bit, as shown in your charts where you compare 80/20 + glidepath vs 100% stocks.
Yes, you are absolutely right, Swiss investors should be more careful than US investors because most investments are in USD and we need CHF.
That’s a fair point indeed. If you are at 100% FI and the market has been doing well for multiple years, you need to be more careful than if you are at 100% FI in a bad market. So, either you get some margin of safety or you switch to some bonds (or cash) and then glidepath back to 100% stocks.
Thanks for sharing your thoughts.
Hi, please consider more simulations with rising equity glidelaths for example 30% to 50%, 30% to 60%, 35% to 55%, etc. for 30 and 35 year retirements which would really be interesting and helpful to millions of us. Thanks!!!
Andrew
Hi Andrew
Consider more glidepaths may be interesting indeed, althought I think that anything below 60% stock is not really interesting, but glidepaths to 60% may be interesting.
Also, 30 and 35 years are easy enough, I am not sure a glide path is really useful there, no? Unless you want to be a bit more aggressive with your withdrawal rate.
Hello Baptiste,
I would like to understand better the 60->100% strategy with +0.3% per month allocated to stocks.
It means that, on my retirement date, if I have a 1 Mio CHF portofolio, I would have :
– year 0: 600k in stocks and 400k in bonds
withdrawal of e.g. 35k first year, assuming still 1 Mio CHF after withdrawal
– year 1: 600k + 0.3*12% of 1 Mio = 636 k in stocks and 364 k in bonds
withdrawal of 35k, assuming still 1 Mio after withdrawal
– year 2 : 636 k + 3.6% of 1 Mio = 672 k in stocks and 328 k in bonds
and so on until I get 1 Mio in stocks about 8 years later.
Is this scenario correct?
Thanks and best regards,
Laurent
Hi Laurent,
It looks right to me, on a yearly view. The goal is indeed to reach 100% (1 mio) stocks in about 11 years.
Of course, in practice, it will vary more because of the stock market returns that are also different on bonds and stocks and this is taken into account in my model. And again, on a bad year, your total value will go down.