Equity Glidepaths im Ruhestand
| Aktualisiert: |
(Offenlegung: Einige der unten aufgeführten Links können Affiliate-Links sein)
On this blog, I have conducted numerous retirement simulations in which the allocation to stocks and bonds remained unchanged. However, there is a belief that modifying allocations can lead to better outcomes.
An equity glidepath is a method to change the stock allocation over time. They can be used during the accumulation and retirement phases.
This article will simulate equity glidepaths in retirement and see if this can improve our results.
Equity glidepaths
As an investor who prefers a passive approach, I avoid changing my portfolio over time. However, I have received numerous requests from my readers regarding equity glidepaths, which have piqued my interest. I am curious to explore their practical application.
An equity glidepath is a way to change your stock allocation over time. For instance, you could go from 80% stocks to 60% stocks over five years. This example would be an equity glidepath.
If this sounds familiar, this may be because you have read about target retirement funds. These funds are proposed by all major fund providers and use a decreasing stock allocation. As you reach your retirement age, your stock allocation goes down. After the target date is reached, the stock allocation will generally not change. This is an example of an equity glidepath in the accumulation phase.
The other alternative is an equity glidepath in retirement. In that case, we change the equity allocation over time after retirement. This is what I want to focus on in this article.
Bonds and stocks are both attractive in a portfolio. Stocks are great for returns, which help for the long-term results of a retirement (make it last longer). And bonds are great against volatility, which is good for fighting sequences of returns risk.
Since we are interested in early retirement, we must consider long periods, up to 50 or even 60 years. For this, we will need a significant allocation to stocks.
In theory, an increasing stock allocation would work best since it would provide long-term and short-term protection. But we will test both.
Simulations
Over time, I have made many simulations on my blog for retirement. The simulations are made following the Trinity Study.
I am using the same data as for other simulations. We will use US stock data from 1871 to 2022 and 10Y US bonds for the same periods. We use monthly returns in each case. And each simulation starts at each possible month in the retirement period.
In the present simulation, I will adapt the stock allocation monthly before the withdrawal. Each adaption will be made with a step (for instance, 0.1% per month). The step will define how fast the glidepath will go.
For this article, I had to calculate the success of several millions of simulations.
Equity glidepath to 100% stocks
We start with an equity glidepath increasing the stock allocation to 100% stocks.
The problem with glidepaths is that there is an infinity of them. You can start at any start point and any endpoint. On top of that, the step of each monthly adjustment can also be anything. So, we have to make some choices.
First, we will test simple glidepaths, from 80% stocks to 100% stocks, with different steps. We can compare that with static 80% and 100% stock allocation portfolios. We will start with 30 years of retirement.
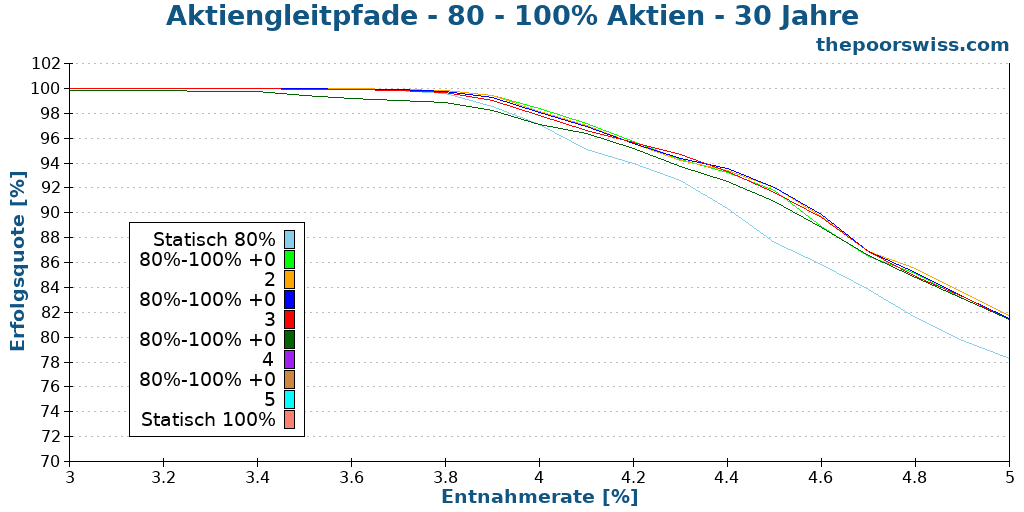
We can see several interesting things. First, a glidepath is a definite improvement over a static 80% portfolio. This allows to increase the success rate significantly. And even more interesting, a glidepath from 80% to 100% is also an improvement over a static 100% stocks portfolio.
Even over a short period, like 30 years of retirement, equity glidepaths are already interesting.
To better see the differences, we can look at the failsafe withdrawal rates of these different simulations. The failsafe withdrawal rate is the highest that would never have failed historically. I can also calculate the highest withdrawal rates for different failure rates.
| Portfolio | Failsafe | 1% | 5% | 10% | 25% |
|---|---|---|---|---|---|
| Static 80% | 3.56 | 3.86 | 4.11 | 4.41 | 5.22 |
| 80%-100% +0.2 | 3.63 | 3.94 | 4.23 | 4.57 | 5.40 |
| 80%-100% +0.3 | 3.61 | 3.93 | 4.25 | 4.59 | 5.43 |
| 80%-100% +0.4 | 3.53 | 3.92 | 4.26 | 4.59 | 5.43 |
| 80%-100% +0.5 | 3.45 | 3.91 | 4.26 | 4.58 | 5.45 |
| Static 100% | 2.84 | 3.70 | 4.21 | 4.54 | 5.47 |
Once again, these results are really interesting. We can see that an equity glidepath provides a significantly higher failsafe withdrawal rate than a static 100% portfolio. And they are also better than the fixed 80% portfolio. So you could use a higher withdrawal rate and retire earlier (since you have to accumulate less).
However, 30 years is a short retirement period if we consider early retirement and is relatively easy to achieve. Therefore, we need to see what happens with 40 years of retirement.
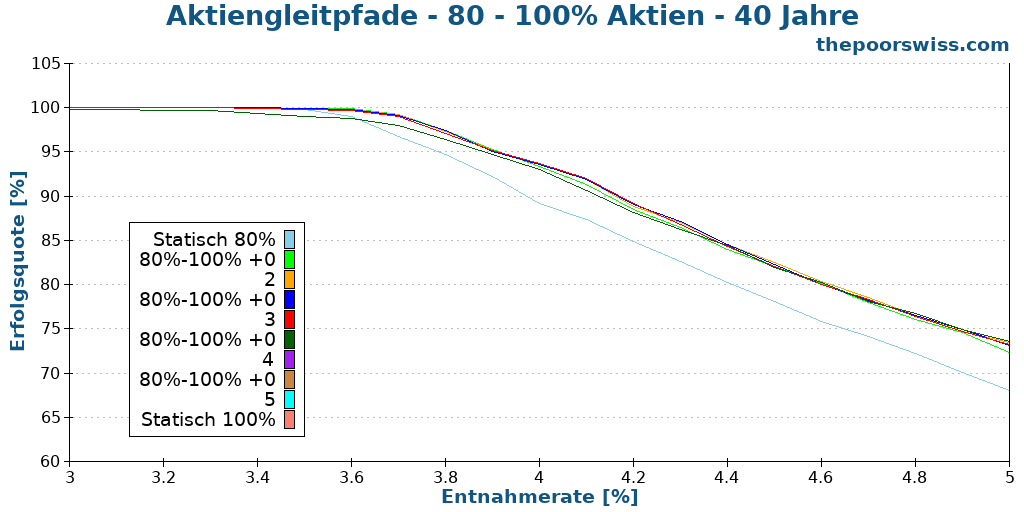
Here, we can see that the results are pretty different. First, we can observe that the static 80% stocks portfolio is already starting to lag for anything higher than 3.6% percent. So, an equity glidepath becomes an interesting improvement over the static portfolio.
Also, we can observe that the differences between the different glidepaths and the static 100% portfolio are less pronounced. We can look at the failsafe withdrawal rates now.
| Portfolio | Failsafe | 1% | 5% | 10% | 25% |
|---|---|---|---|---|---|
| Static 80% | 3.35 | 3.60 | 3.77 | 3.97 | 4.65 |
| 80%-100% +0.2 | 3.49 | 3.71 | 3.92 | 4.14 | 4.86 |
| 80%-100% +0.3 | 3.47 | 3.71 | 3.90 | 4.16 | 4.88 |
| 80%-100% +0.4 | 3.40 | 3.71 | 3.91 | 4.16 | 4.89 |
| 80%-100% +0.5 | 3.31 | 3.70 | 3.91 | 4.17 | 4.88 |
| Static 100% | 2.73 | 3.52 | 3.89 | 4.12 | 4.89 |
If you aim for a failsafe withdrawal rate, an equity glidepath will provide significant improvements. Without allowing a large failure rate, higher withdrawal rates are obtained with equity glidepaths.
Finally, we move to 50 years as our final simulation period.
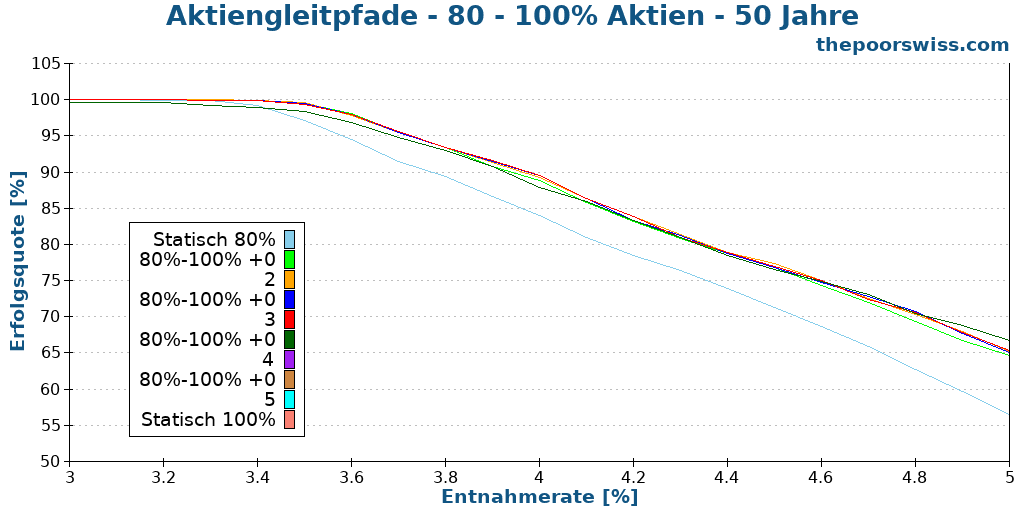
These results are very similar to the one for 40 years, but all numbers are a bit lower. We can look directly at failsafe withdrawal rates to compare them.
| Portfolio | Failsafe | 1% | 5% | 10% | 25% |
|---|---|---|---|---|---|
| Static 80% | 3.19 | 3.41 | 3.57 | 3.78 | 4.35 |
| 80%-100% +0.2 | 3.37 | 3.55 | 3.72 | 3.96 | 4.57 |
| 80%-100% +0.3 | 3.35 | 3.54 | 3.72 | 3.95 | 4.60 |
| 80%-100% +0.4 | 3.28 | 3.54 | 3.72 | 3.96 | 4.59 |
| 80%-100% +0.5 | 3.20 | 3.54 | 3.72 | 3.96 | 4.60 |
| Static 100% | 2.63 | 3.35 | 3.69 | 3.93 | 4.59 |
Interestingly, these equity glidepaths provide a significant improvement over static portfolios. With a low failure rate, these glidepaths let you withdraw more money from your portfolio.
We can also look at what happens when we start at 60% instead of starting at 80%.
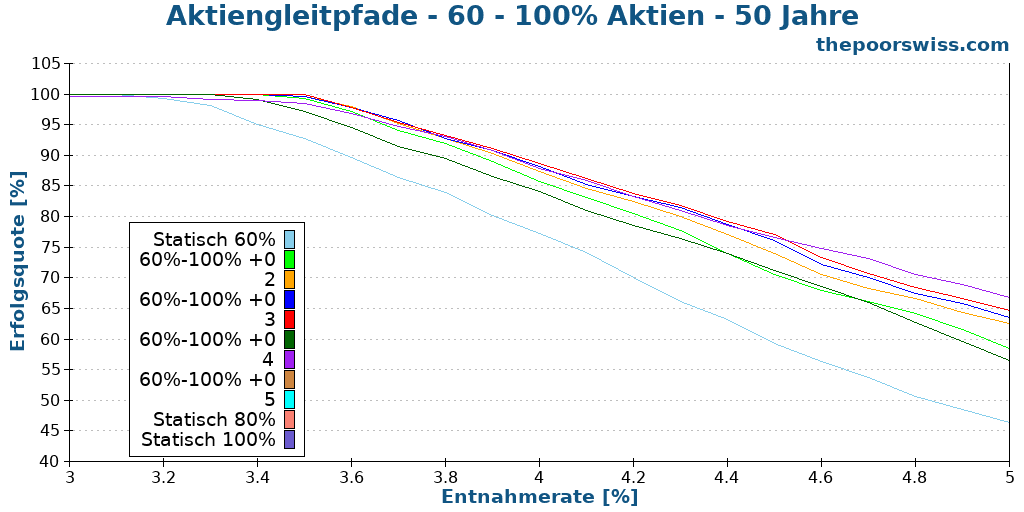
These results are much better than I expected for 60% of stocks. An equity glidepath significantly improves the performance over a static 60% stock portfolio.
We look at the failsafe withdrawal rates and compare them against the 80% starting point.
| Portfolio | Failsafe | 1% | 5% | 10% | 25% |
|---|---|---|---|---|---|
| Static 60% | 3.09 | 3.24 | 3.40 | 3.59 | 4.08 |
| 60%-100% +0.2 | 3.38 | 3.51 | 3.66 | 3.88 | 4.36 |
| 60%-100% +0.3 | 3.46 | 3.55 | 3.70 | 3.91 | 4.47 |
| 60%-100% +0.4 | 3.45 | 3.53 | 3.72 | 3.92 | 4.54 |
| 60%-100% +0.5 | 3.46 | 3.55 | 3.71 | 3.94 | 4.56 |
| Static 80% | 3.19 | 3.41 | 3.57 | 3.78 | 4.35 |
| 80%-100% +0.2 | 3.37 | 3.55 | 3.72 | 3.96 | 4.57 |
| 80%-100% +0.3 | 3.35 | 3.54 | 3.72 | 3.95 | 4.60 |
| 80%-100% +0.4 | 3.28 | 3.54 | 3.72 | 3.96 | 4.59 |
| 80%-100% +0.5 | 3.20 | 3.54 | 3.72 | 3.96 | 4.60 |
| Static 100% | 2.63 | 3.35 | 3.69 | 3.93 | 4.59 |
Again, these results are very interesting. I was not expecting a 60% starting point to be that good. A 60% to 100% glidepath performs better than the 80% to 100% glidepath in some situations, especially in failsafe.
Equity glidepath to 80% stocks
We can also test a second target, 80% stocks instead of 100% stocks. This time, we will start directly at 50 years of retirement, which is the most interesting retirement duration.
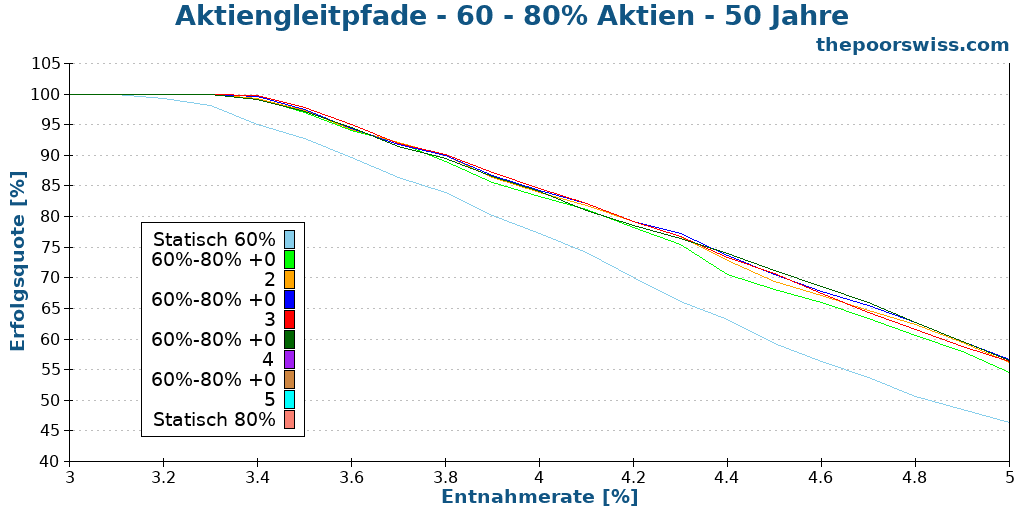
We can observe that the glidepaths significantly boost the success rate of the static 60% stocks portfolio. In some cases, by switching from a static portfolio to a glidepath, we can increase our success rate by 10%.
We can see the failsafe withdrawal rates again for these results.
| Portfolio | Failsafe | 1% | 5% | 10% | 25% |
|---|---|---|---|---|---|
| Static 60% | 3.09 | 3.24 | 3.40 | 3.59 | 4.08 |
| 60%-80% +0.2 | 3.28 | 3.42 | 3.56 | 3.77 | 4.31 |
| 60%-80% +0.3 | 3.32 | 3.42 | 3.57 | 3.79 | 4.34 |
| 60%-80% +0.4 | 3.36 | 3.41 | 3.57 | 3.79 | 4.36 |
| 60%-80% +0.5 | 3.37 | 3.44 | 3.60 | 3.80 | 4.36 |
| Static 80% | 3.19 | 3.41 | 3.57 | 3.78 | 4.35 |
These results are even better than what we observed before. Indeed, the best withdrawal rate is always obtained with an equity glidepath. On average, the best glidepath is the fastest one.
We can see what happens if we use a 40% starting point.
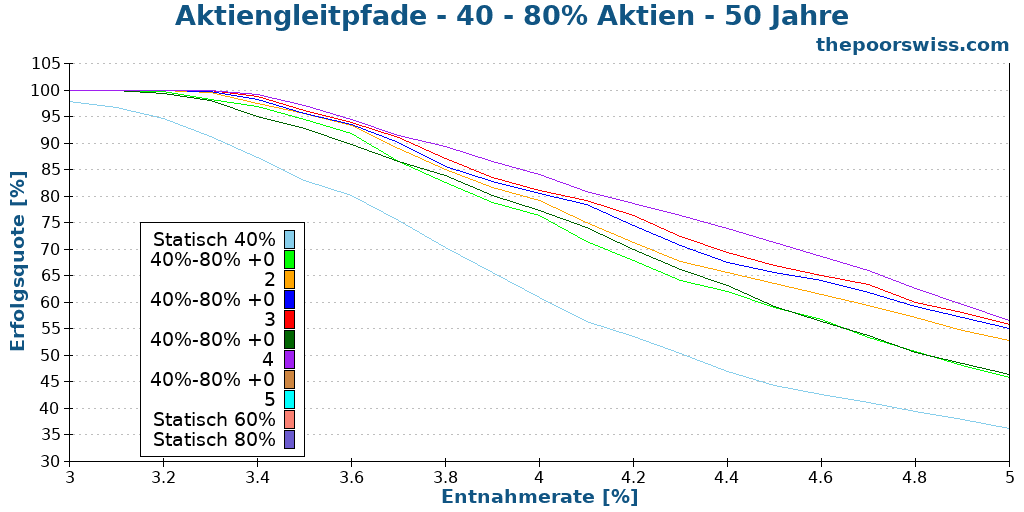
We can observe two things here. First, as we have seen in other articles, 40% is insufficient for long retirement periods. Second, equity glidepaths are always improving over the static 40% portfolio. This makes sense since this portfolio has good volatility but poor returns.
Again, we look at the failsafe withdrawal rates.
| Portfolio | Failsafe | 1% | 5% | 10% | 25% |
|---|---|---|---|---|---|
| Static 40% | 2.80 | 2.96 | 3.19 | 3.32 | 3.71 |
| 40%-80% +0.2 | 3.11 | 3.26 | 3.48 | 3.62 | 4.03 |
| 40%-80% +0.3 | 3.17 | 3.32 | 3.52 | 3.67 | 4.10 |
| 40%-80% +0.4 | 3.25 | 3.37 | 3.52 | 3.70 | 4.18 |
| 40%-80% +0.5 | 3.28 | 3.38 | 3.54 | 3.71 | 4.24 |
| Static 60% | 3.09 | 3.24 | 3.40 | 3.59 | 4.08 |
| Static 80% | 3.19 | 3.41 | 3.57 | 3.78 | 4.35 |
The equity glidepaths significantly improve the static 40% and even the static 60% portfolios. However, these results are still not great compared to the previous results. In practice, 40% of stocks are insufficient for a long early retirement.
Reverse glidepaths
We should verify our hypothesis that the glidepath should increase our stock allocation. To do that, I have also tested a few reverse equity glidepaths. The difference is that we go from 100% stocks to 80% stocks.
Here are the results for 50 years of retirement.
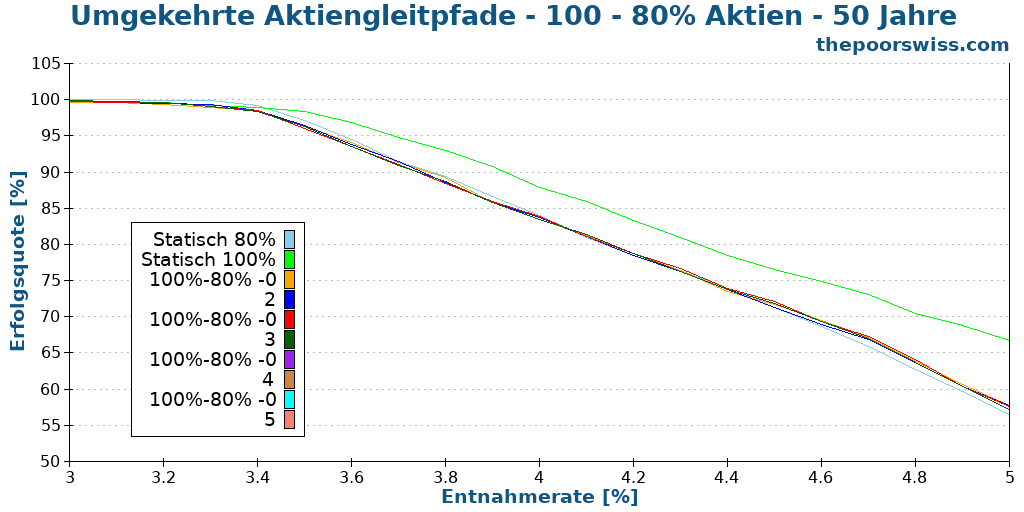
As expected, the best portfolio remains the static 100% portfolio. Adding bonds to a stock portfolio does not help in retirement. We can look at the failsafe rates again.
| Portfolio | Failsafe | 1% | 5% | 10% | 25% |
|---|---|---|---|---|---|
| Static 80% | 3.19 | 3.41 | 3.57 | 3.78 | 4.35 |
| Static 100% | 2.63 | 3.35 | 3.69 | 3.93 | 4.59 |
| 100%-80% -0.2 | 2.61 | 3.29 | 3.55 | 3.77 | 4.35 |
| 100%-80% -0.3 | 2.66 | 3.32 | 3.54 | 3.75 | 4.37 |
| 100%-80% -0.4 | 2.69 | 3.32 | 3.53 | 3.74 | 4.37 |
| 100%-80% -0.5 | 2.77 | 3.32 | 3.54 | 3.74 | 4.35 |
The equity glidepaths improve slightly over the static 100% stocks portfolio for the failsafe withdrawal rate, but they are strictly worse than the static 80% stocks. In all other cases, the static portfolios are better.
Again, this makes sense because we are using bonds for the long term while they should be used for the short term. So, reverse equity glidepaths should not be used.
Summary
Finally, we can look at all the glidepaths in a summary table and draw some conclusions.
| Portfolio | Failsafe | 1% | 5% | 10% | 25% |
|---|---|---|---|---|---|
| Static 40% | 2.80 | 2.96 | 3.19 | 3.32 | 3.71 |
| 40%-80% +0.2 | 3.11 | 3.26 | 3.48 | 3.62 | 4.03 |
| 40%-80% +0.3 | 3.17 | 3.32 | 3.52 | 3.67 | 4.10 |
| 40%-80% +0.4 | 3.25 | 3.37 | 3.52 | 3.70 | 4.18 |
| 40%-80% +0.5 | 3.28 | 3.38 | 3.54 | 3.71 | 4.24 |
| 40%-100% 0.2 | 3.15 | 3.27 | 3.52 | 3.66 | 4.09 |
| 40%-100% +0.3 | 3.27 | 3.43 | 3.60 | 3.77 | 4.16 |
| 40%-100% +0.4 | 3.35 | 3.48 | 3.65 | 3.81 | 4.27 |
| 40%-100% +0.5 | 3.43 | 3.51 | 3.65 | 3.83 | 4.35 |
| Static 60% | 3.09 | 3.24 | 3.40 | 3.59 | 4.08 |
| 60%-80% +0.2 | 3.28 | 3.42 | 3.56 | 3.77 | 4.31 |
| 60%-80% +0.3 | 3.32 | 3.42 | 3.57 | 3.79 | 4.34 |
| 60%-80% +0.4 | 3.36 | 3.41 | 3.57 | 3.79 | 4.36 |
| 60%-80% +0.5 | 3.37 | 3.44 | 3.60 | 3.80 | 4.36 |
| 60%-100% +0.2 | 3.38 | 3.51 | 3.66 | 3.88 | 4.36 |
| 60%-100% +0.3 | 3.46 | 3.55 | 3.70 | 3.91 | 4.47 |
| 60%-100% +0.4 | 3.45 | 3.53 | 3.72 | 3.92 | 4.54 |
| 60%-100% +0.5 | 3.46 | 3.55 | 3.71 | 3.94 | 4.56 |
| Static 80% | 3.19 | 3.41 | 3.57 | 3.78 | 4.35 |
| 80%-100% +0.2 | 3.37 | 3.55 | 3.72 | 3.96 | 4.57 |
| 80%-100% +0.3 | 3.35 | 3.54 | 3.72 | 3.95 | 4.60 |
| 80%-100% +0.4 | 3.28 | 3.54 | 3.72 | 3.96 | 4.59 |
| 80%-100% +0.5 | 3.20 | 3.54 | 3.72 | 3.96 | 4.60 |
| Static 100% | 2.63 | 3.35 | 3.69 | 3.93 | 4.59 |
For me, the most interesting result is that an equity glidepath is always an improvement over the static portfolio of the starting point. And it is also often an improvement over the static portfolio of the ending point.
I am surprised by the efficiency of the 60% to 100% equity glidepaths. I was not expecting them to perform that well. I was expecting 80% to 100% to be better. But they are only better if you allow higher failure rates in your planning.
If you have a significant difference between your starting and ending points, you will need a quick glidepath. In the future, I may consider more glide speeds.
Another interesting fact is that if you are interested in failsafe strategies, you can take a relatively slow glidepath. But if you allow a higher failure rate, you could take a slower glidepath.
We should also ask ourselves whether an equity glidepath is always better? Glidepaths are great when we start at a bad time. The worse times to retire are at the peaks of the market. In these cases, you want bonds to have low volatility so your portfolio will not tank too much.
But an equity glidepath will perform significantly worse than a static portfolio with more stocks when we start at a good time. The best times to retire are at the bottom of the markets. In these cases, you want a heavy stock portfolio to grow your portfolio quickly.
So, equity glidepaths are great for improving the average success rate, but they still have disadvantages in some cases. Nevertheless, if you want a safe retirement strategy, these equity glidepaths are worth considering.
Conclusion
Equity glidepaths are a great way to improve your success rate in retirement. Instead of having a fixed stock allocation, we can increase it from a starting point over time. For instance, an equity glidepath from 60% stocks to 100% stocks performs well if you want to focus on failsafe withdrawal rates.
Both bonds and stocks offer unique advantages. Bonds are an excellent option for protecting against sequences of returns risk due to their lower volatility. Meanwhile, stocks can help prevent running out of money with higher returns. Therefore, it is wise to consider relying on bonds in the early years when sequences of returns risk are a concern, while stocks may be more beneficial in later years to ensure the longevity of your portfolio.
As a result, it makes a lot of sense to start with bonds and slowly decrease their allocation. That way, bonds, and stocks are doing what they are best at. As a result, we get better success rates and could use a higher withdrawal rate for the same target failure rate.
People considering retiring with a fixed allocation to bonds should highly consider an equity glidepath. This will likely result in safer retirement.
These results make me reconsider my 100% stock portfolio in retirement. This portfolio is excellent for the accumulation phase but may be suboptimal in retirement. I will have to think about this more.
Interestingly, we can also do a simpler glidepath by only selling bonds in retirement. This way we will have a glidepath where the bonds part will slowly disappear, and then we will be left with stocks only. And if you like having dynamic parameters in retirement, you may like dynamic withdrawal rates.
Are you planning to retire with bonds? Are you considering an equity glidepath?
If you are interested in the subject, I could run more experiments on equity glidepaths because there are more parameters to explore.
Mehr zum Lesen

Ein zusätzliches Einkommen im Ruhestand ist sehr hilfreich.
Planen Sie, frühzeitig in Rente zu gehen, und möchten Sie Ihre Chancen verbessern? Würde ein Einkommen im Ruhestand Ihre Erfolgschancen verbessern? Wir machen den Test!
Wie wählt man einen sicheren Abhebungssatz?
Die sichere Entnahmerate (SWR) ist ein grundlegender Bestandteil Ihrer Ruhestandsplanung. Hier finden Sie eine Schritt-für-Schritt-Anleitung, wie Sie sie für sich auswählen können!
Fügen Sie Ihrem FIRE-Plan eine gewisse Sicherheitsmarge hinzu
Ein guter FIRE-Plan stützt sich auf historische Daten, daher müssen wir ihn mit einer gewissen Sicherheitsspanne schützen! Hier finden Sie einige Möglichkeiten, um zusätzliche Sicherheit zu erreichen!
Erfahren Sie, wie Sie Ihre Finanzen ganz einfach optimieren und in der Schweiz Tausende sparen können, mit unserem exklusiven E-Book. Entdecken Sie die kostengünstigsten Finanzdienstleistungen, maßgeschneidert für clevere Einwohner und Expats!
Ihren KOSTENLOSEN Schweizer Sparratgeber
Hy! Sehr spannender in deep Artikel. Eine Frage die mich beschäftigt ist, wie man equity glidepaths praktisch umsetzt. Empfehlen Sie ein solches Vorgehen auch für die 3a Säule?
Ich würde sagen, nein. Sie sollten diese Technik auf Ihr gesamtes Portfolio anwenden. Aber wenn Ihre 3a nicht einen sehr großen Teil Ihres Portfolios ausmacht, was bei einem Vorruhestand unwahrscheinlich ist, denke ich, dass es ausreicht, die Methode nur auf das Aktienportfolio anzuwenden.