Equity glidepaths à la retraite
| Mis à jour: |
(Information: certains des liens ci-dessous peuvent être des liens d'affiliation)
On this blog, I have conducted numerous retirement simulations in which the allocation to stocks and bonds remained unchanged. However, there is a belief that modifying allocations can lead to better outcomes.
An equity glidepath is a method to change the stock allocation over time. They can be used during the accumulation and retirement phases.
This article will simulate equity glidepaths in retirement and see if this can improve our results.
Equity glidepaths
As an investor who prefers a passive approach, I avoid changing my portfolio over time. However, I have received numerous requests from my readers regarding equity glidepaths, which have piqued my interest. I am curious to explore their practical application.
An equity glidepath is a way to change your stock allocation over time. For instance, you could go from 80% stocks to 60% stocks over five years. This example would be an equity glidepath.
If this sounds familiar, this may be because you have read about target retirement funds. These funds are proposed by all major fund providers and use a decreasing stock allocation. As you reach your retirement age, your stock allocation goes down. After the target date is reached, the stock allocation will generally not change. This is an example of an equity glidepath in the accumulation phase.
The other alternative is an equity glidepath in retirement. In that case, we change the equity allocation over time after retirement. This is what I want to focus on in this article.
Bonds and stocks are both attractive in a portfolio. Stocks are great for returns, which help for the long-term results of a retirement (make it last longer). And bonds are great against volatility, which is good for fighting sequences of returns risk.
Since we are interested in early retirement, we must consider long periods, up to 50 or even 60 years. For this, we will need a significant allocation to stocks.
In theory, an increasing stock allocation would work best since it would provide long-term and short-term protection. But we will test both.
Simulations
Over time, I have made many simulations on my blog for retirement. The simulations are made following the Trinity Study.
I am using the same data as for other simulations. We will use US stock data from 1871 to 2022 and 10Y US bonds for the same periods. We use monthly returns in each case. And each simulation starts at each possible month in the retirement period.
In the present simulation, I will adapt the stock allocation monthly before the withdrawal. Each adaption will be made with a step (for instance, 0.1% per month). The step will define how fast the glidepath will go.
For this article, I had to calculate the success of several millions of simulations.
Equity glidepath to 100% stocks
We start with an equity glidepath increasing the stock allocation to 100% stocks.
The problem with glidepaths is that there is an infinity of them. You can start at any start point and any endpoint. On top of that, the step of each monthly adjustment can also be anything. So, we have to make some choices.
First, we will test simple glidepaths, from 80% stocks to 100% stocks, with different steps. We can compare that with static 80% and 100% stock allocation portfolios. We will start with 30 years of retirement.
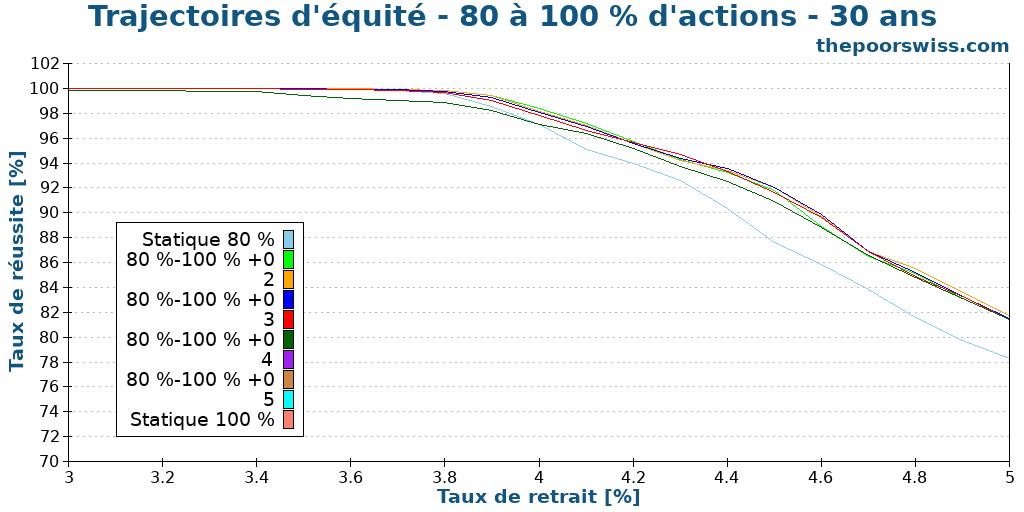
We can see several interesting things. First, a glidepath is a definite improvement over a static 80% portfolio. This allows to increase the success rate significantly. And even more interesting, a glidepath from 80% to 100% is also an improvement over a static 100% stocks portfolio.
Even over a short period, like 30 years of retirement, equity glidepaths are already interesting.
To better see the differences, we can look at the failsafe withdrawal rates of these different simulations. The failsafe withdrawal rate is the highest that would never have failed historically. I can also calculate the highest withdrawal rates for different failure rates.
| Portfolio | Failsafe | 1% | 5% | 10% | 25% |
|---|---|---|---|---|---|
| Static 80% | 3.56 | 3.86 | 4.11 | 4.41 | 5.22 |
| 80%-100% +0.2 | 3.63 | 3.94 | 4.23 | 4.57 | 5.40 |
| 80%-100% +0.3 | 3.61 | 3.93 | 4.25 | 4.59 | 5.43 |
| 80%-100% +0.4 | 3.53 | 3.92 | 4.26 | 4.59 | 5.43 |
| 80%-100% +0.5 | 3.45 | 3.91 | 4.26 | 4.58 | 5.45 |
| Static 100% | 2.84 | 3.70 | 4.21 | 4.54 | 5.47 |
Once again, these results are really interesting. We can see that an equity glidepath provides a significantly higher failsafe withdrawal rate than a static 100% portfolio. And they are also better than the fixed 80% portfolio. So you could use a higher withdrawal rate and retire earlier (since you have to accumulate less).
However, 30 years is a short retirement period if we consider early retirement and is relatively easy to achieve. Therefore, we need to see what happens with 40 years of retirement.
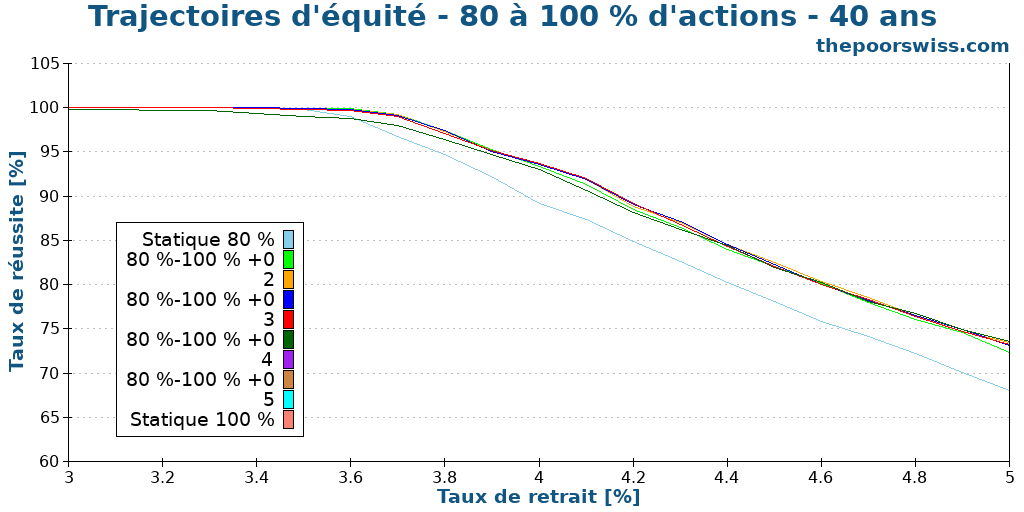
Here, we can see that the results are pretty different. First, we can observe that the static 80% stocks portfolio is already starting to lag for anything higher than 3.6% percent. So, an equity glidepath becomes an interesting improvement over the static portfolio.
Also, we can observe that the differences between the different glidepaths and the static 100% portfolio are less pronounced. We can look at the failsafe withdrawal rates now.
| Portfolio | Failsafe | 1% | 5% | 10% | 25% |
|---|---|---|---|---|---|
| Static 80% | 3.35 | 3.60 | 3.77 | 3.97 | 4.65 |
| 80%-100% +0.2 | 3.49 | 3.71 | 3.92 | 4.14 | 4.86 |
| 80%-100% +0.3 | 3.47 | 3.71 | 3.90 | 4.16 | 4.88 |
| 80%-100% +0.4 | 3.40 | 3.71 | 3.91 | 4.16 | 4.89 |
| 80%-100% +0.5 | 3.31 | 3.70 | 3.91 | 4.17 | 4.88 |
| Static 100% | 2.73 | 3.52 | 3.89 | 4.12 | 4.89 |
If you aim for a failsafe withdrawal rate, an equity glidepath will provide significant improvements. Without allowing a large failure rate, higher withdrawal rates are obtained with equity glidepaths.
Finally, we move to 50 years as our final simulation period.
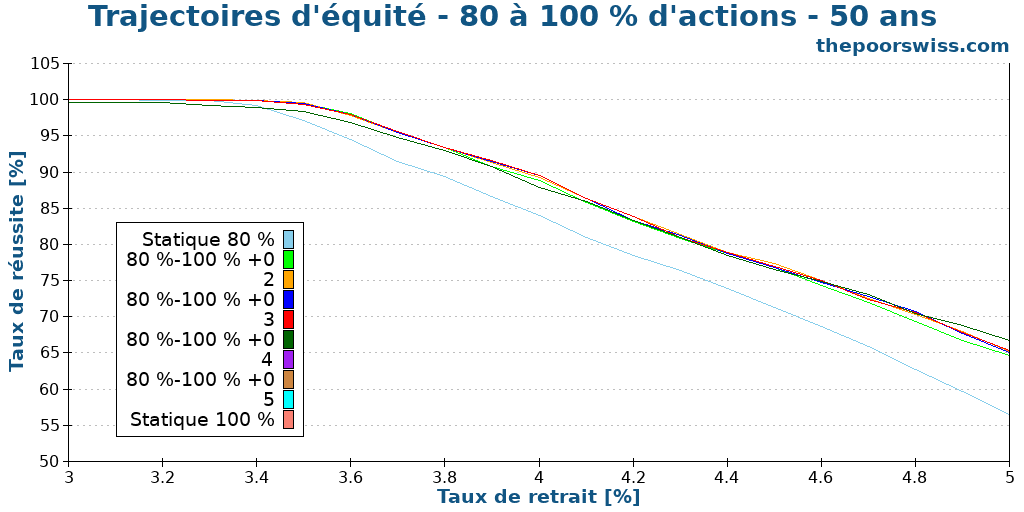
These results are very similar to the one for 40 years, but all numbers are a bit lower. We can look directly at failsafe withdrawal rates to compare them.
| Portfolio | Failsafe | 1% | 5% | 10% | 25% |
|---|---|---|---|---|---|
| Static 80% | 3.19 | 3.41 | 3.57 | 3.78 | 4.35 |
| 80%-100% +0.2 | 3.37 | 3.55 | 3.72 | 3.96 | 4.57 |
| 80%-100% +0.3 | 3.35 | 3.54 | 3.72 | 3.95 | 4.60 |
| 80%-100% +0.4 | 3.28 | 3.54 | 3.72 | 3.96 | 4.59 |
| 80%-100% +0.5 | 3.20 | 3.54 | 3.72 | 3.96 | 4.60 |
| Static 100% | 2.63 | 3.35 | 3.69 | 3.93 | 4.59 |
Interestingly, these equity glidepaths provide a significant improvement over static portfolios. With a low failure rate, these glidepaths let you withdraw more money from your portfolio.
We can also look at what happens when we start at 60% instead of starting at 80%.
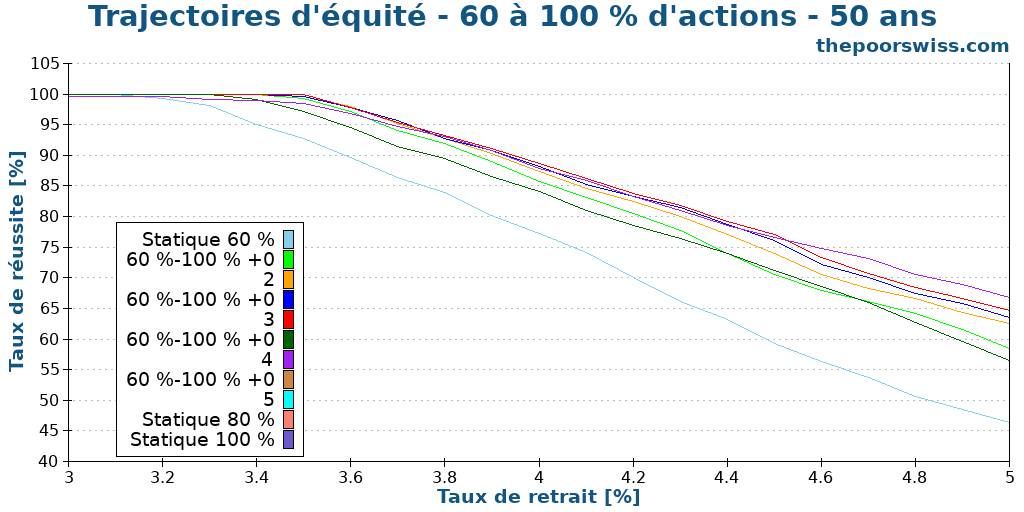
These results are much better than I expected for 60% of stocks. An equity glidepath significantly improves the performance over a static 60% stock portfolio.
We look at the failsafe withdrawal rates and compare them against the 80% starting point.
| Portfolio | Failsafe | 1% | 5% | 10% | 25% |
|---|---|---|---|---|---|
| Static 60% | 3.09 | 3.24 | 3.40 | 3.59 | 4.08 |
| 60%-100% +0.2 | 3.38 | 3.51 | 3.66 | 3.88 | 4.36 |
| 60%-100% +0.3 | 3.46 | 3.55 | 3.70 | 3.91 | 4.47 |
| 60%-100% +0.4 | 3.45 | 3.53 | 3.72 | 3.92 | 4.54 |
| 60%-100% +0.5 | 3.46 | 3.55 | 3.71 | 3.94 | 4.56 |
| Static 80% | 3.19 | 3.41 | 3.57 | 3.78 | 4.35 |
| 80%-100% +0.2 | 3.37 | 3.55 | 3.72 | 3.96 | 4.57 |
| 80%-100% +0.3 | 3.35 | 3.54 | 3.72 | 3.95 | 4.60 |
| 80%-100% +0.4 | 3.28 | 3.54 | 3.72 | 3.96 | 4.59 |
| 80%-100% +0.5 | 3.20 | 3.54 | 3.72 | 3.96 | 4.60 |
| Static 100% | 2.63 | 3.35 | 3.69 | 3.93 | 4.59 |
Again, these results are very interesting. I was not expecting a 60% starting point to be that good. A 60% to 100% glidepath performs better than the 80% to 100% glidepath in some situations, especially in failsafe.
Equity glidepath to 80% stocks
We can also test a second target, 80% stocks instead of 100% stocks. This time, we will start directly at 50 years of retirement, which is the most interesting retirement duration.
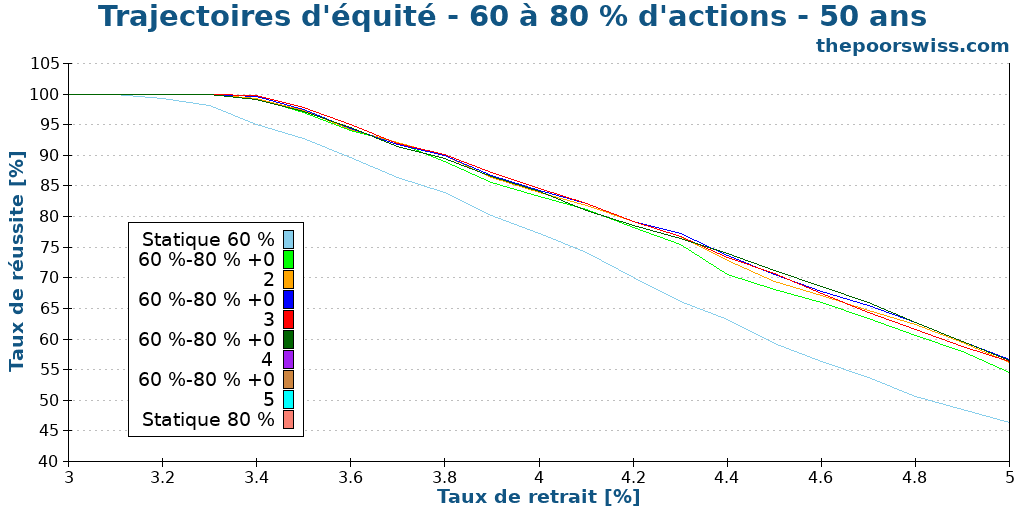
We can observe that the glidepaths significantly boost the success rate of the static 60% stocks portfolio. In some cases, by switching from a static portfolio to a glidepath, we can increase our success rate by 10%.
We can see the failsafe withdrawal rates again for these results.
| Portfolio | Failsafe | 1% | 5% | 10% | 25% |
|---|---|---|---|---|---|
| Static 60% | 3.09 | 3.24 | 3.40 | 3.59 | 4.08 |
| 60%-80% +0.2 | 3.28 | 3.42 | 3.56 | 3.77 | 4.31 |
| 60%-80% +0.3 | 3.32 | 3.42 | 3.57 | 3.79 | 4.34 |
| 60%-80% +0.4 | 3.36 | 3.41 | 3.57 | 3.79 | 4.36 |
| 60%-80% +0.5 | 3.37 | 3.44 | 3.60 | 3.80 | 4.36 |
| Static 80% | 3.19 | 3.41 | 3.57 | 3.78 | 4.35 |
These results are even better than what we observed before. Indeed, the best withdrawal rate is always obtained with an equity glidepath. On average, the best glidepath is the fastest one.
We can see what happens if we use a 40% starting point.
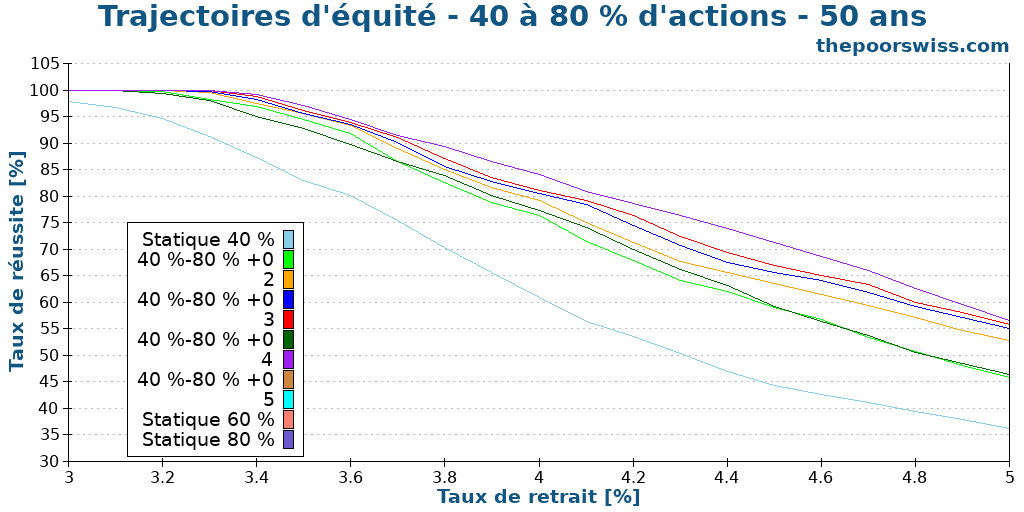
We can observe two things here. First, as we have seen in other articles, 40% is insufficient for long retirement periods. Second, equity glidepaths are always improving over the static 40% portfolio. This makes sense since this portfolio has good volatility but poor returns.
Again, we look at the failsafe withdrawal rates.
| Portfolio | Failsafe | 1% | 5% | 10% | 25% |
|---|---|---|---|---|---|
| Static 40% | 2.80 | 2.96 | 3.19 | 3.32 | 3.71 |
| 40%-80% +0.2 | 3.11 | 3.26 | 3.48 | 3.62 | 4.03 |
| 40%-80% +0.3 | 3.17 | 3.32 | 3.52 | 3.67 | 4.10 |
| 40%-80% +0.4 | 3.25 | 3.37 | 3.52 | 3.70 | 4.18 |
| 40%-80% +0.5 | 3.28 | 3.38 | 3.54 | 3.71 | 4.24 |
| Static 60% | 3.09 | 3.24 | 3.40 | 3.59 | 4.08 |
| Static 80% | 3.19 | 3.41 | 3.57 | 3.78 | 4.35 |
The equity glidepaths significantly improve the static 40% and even the static 60% portfolios. However, these results are still not great compared to the previous results. In practice, 40% of stocks are insufficient for a long early retirement.
Reverse glidepaths
We should verify our hypothesis that the glidepath should increase our stock allocation. To do that, I have also tested a few reverse equity glidepaths. The difference is that we go from 100% stocks to 80% stocks.
Here are the results for 50 years of retirement.
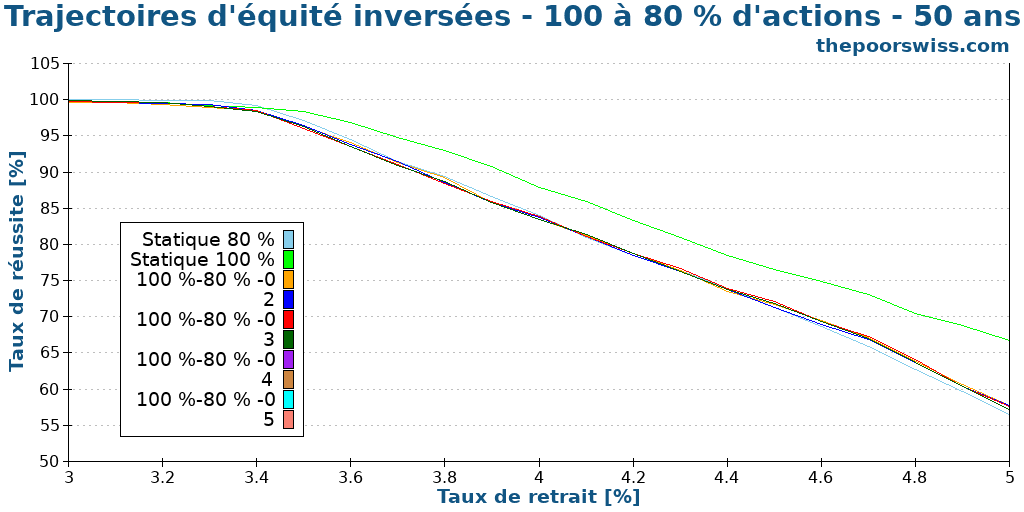
As expected, the best portfolio remains the static 100% portfolio. Adding bonds to a stock portfolio does not help in retirement. We can look at the failsafe rates again.
| Portfolio | Failsafe | 1% | 5% | 10% | 25% |
|---|---|---|---|---|---|
| Static 80% | 3.19 | 3.41 | 3.57 | 3.78 | 4.35 |
| Static 100% | 2.63 | 3.35 | 3.69 | 3.93 | 4.59 |
| 100%-80% -0.2 | 2.61 | 3.29 | 3.55 | 3.77 | 4.35 |
| 100%-80% -0.3 | 2.66 | 3.32 | 3.54 | 3.75 | 4.37 |
| 100%-80% -0.4 | 2.69 | 3.32 | 3.53 | 3.74 | 4.37 |
| 100%-80% -0.5 | 2.77 | 3.32 | 3.54 | 3.74 | 4.35 |
The equity glidepaths improve slightly over the static 100% stocks portfolio for the failsafe withdrawal rate, but they are strictly worse than the static 80% stocks. In all other cases, the static portfolios are better.
Again, this makes sense because we are using bonds for the long term while they should be used for the short term. So, reverse equity glidepaths should not be used.
Summary
Finally, we can look at all the glidepaths in a summary table and draw some conclusions.
| Portfolio | Failsafe | 1% | 5% | 10% | 25% |
|---|---|---|---|---|---|
| Static 40% | 2.80 | 2.96 | 3.19 | 3.32 | 3.71 |
| 40%-80% +0.2 | 3.11 | 3.26 | 3.48 | 3.62 | 4.03 |
| 40%-80% +0.3 | 3.17 | 3.32 | 3.52 | 3.67 | 4.10 |
| 40%-80% +0.4 | 3.25 | 3.37 | 3.52 | 3.70 | 4.18 |
| 40%-80% +0.5 | 3.28 | 3.38 | 3.54 | 3.71 | 4.24 |
| 40%-100% 0.2 | 3.15 | 3.27 | 3.52 | 3.66 | 4.09 |
| 40%-100% +0.3 | 3.27 | 3.43 | 3.60 | 3.77 | 4.16 |
| 40%-100% +0.4 | 3.35 | 3.48 | 3.65 | 3.81 | 4.27 |
| 40%-100% +0.5 | 3.43 | 3.51 | 3.65 | 3.83 | 4.35 |
| Static 60% | 3.09 | 3.24 | 3.40 | 3.59 | 4.08 |
| 60%-80% +0.2 | 3.28 | 3.42 | 3.56 | 3.77 | 4.31 |
| 60%-80% +0.3 | 3.32 | 3.42 | 3.57 | 3.79 | 4.34 |
| 60%-80% +0.4 | 3.36 | 3.41 | 3.57 | 3.79 | 4.36 |
| 60%-80% +0.5 | 3.37 | 3.44 | 3.60 | 3.80 | 4.36 |
| 60%-100% +0.2 | 3.38 | 3.51 | 3.66 | 3.88 | 4.36 |
| 60%-100% +0.3 | 3.46 | 3.55 | 3.70 | 3.91 | 4.47 |
| 60%-100% +0.4 | 3.45 | 3.53 | 3.72 | 3.92 | 4.54 |
| 60%-100% +0.5 | 3.46 | 3.55 | 3.71 | 3.94 | 4.56 |
| Static 80% | 3.19 | 3.41 | 3.57 | 3.78 | 4.35 |
| 80%-100% +0.2 | 3.37 | 3.55 | 3.72 | 3.96 | 4.57 |
| 80%-100% +0.3 | 3.35 | 3.54 | 3.72 | 3.95 | 4.60 |
| 80%-100% +0.4 | 3.28 | 3.54 | 3.72 | 3.96 | 4.59 |
| 80%-100% +0.5 | 3.20 | 3.54 | 3.72 | 3.96 | 4.60 |
| Static 100% | 2.63 | 3.35 | 3.69 | 3.93 | 4.59 |
For me, the most interesting result is that an equity glidepath is always an improvement over the static portfolio of the starting point. And it is also often an improvement over the static portfolio of the ending point.
I am surprised by the efficiency of the 60% to 100% equity glidepaths. I was not expecting them to perform that well. I was expecting 80% to 100% to be better. But they are only better if you allow higher failure rates in your planning.
If you have a significant difference between your starting and ending points, you will need a quick glidepath. In the future, I may consider more glide speeds.
Another interesting fact is that if you are interested in failsafe strategies, you can take a relatively slow glidepath. But if you allow a higher failure rate, you could take a slower glidepath.
We should also ask ourselves whether an equity glidepath is always better? Glidepaths are great when we start at a bad time. The worse times to retire are at the peaks of the market. In these cases, you want bonds to have low volatility so your portfolio will not tank too much.
But an equity glidepath will perform significantly worse than a static portfolio with more stocks when we start at a good time. The best times to retire are at the bottom of the markets. In these cases, you want a heavy stock portfolio to grow your portfolio quickly.
So, equity glidepaths are great for improving the average success rate, but they still have disadvantages in some cases. Nevertheless, if you want a safe retirement strategy, these equity glidepaths are worth considering.
Conclusion
Equity glidepaths are a great way to improve your success rate in retirement. Instead of having a fixed stock allocation, we can increase it from a starting point over time. For instance, an equity glidepath from 60% stocks to 100% stocks performs well if you want to focus on failsafe withdrawal rates.
Both bonds and stocks offer unique advantages. Bonds are an excellent option for protecting against sequences of returns risk due to their lower volatility. Meanwhile, stocks can help prevent running out of money with higher returns. Therefore, it is wise to consider relying on bonds in the early years when sequences of returns risk are a concern, while stocks may be more beneficial in later years to ensure the longevity of your portfolio.
As a result, it makes a lot of sense to start with bonds and slowly decrease their allocation. That way, bonds, and stocks are doing what they are best at. As a result, we get better success rates and could use a higher withdrawal rate for the same target failure rate.
People considering retiring with a fixed allocation to bonds should highly consider an equity glidepath. This will likely result in safer retirement.
These results make me reconsider my 100% stock portfolio in retirement. This portfolio is excellent for the accumulation phase but may be suboptimal in retirement. I will have to think about this more.
Interestingly, we can also do a simpler glidepath by only selling bonds in retirement. This way we will have a glidepath where the bonds part will slowly disappear, and then we will be left with stocks only. And if you like having dynamic parameters in retirement, you may like dynamic withdrawal rates.
Are you planning to retire with bonds? Are you considering an equity glidepath?
If you are interested in the subject, I could run more experiments on equity glidepaths because there are more parameters to explore.
Prochains articles

La règle des 4 % fonctionne-t-elle ces dernières années ?
La règle des 4 % fonctionne-t-elle toujours ? Nous analysons la performance du taux de retrait sécurisé en utilisant les données de marché et les conditions économiques les plus récentes.
Peut-on prendre une retraite anticipée sans avoir un blog à succès ?
La retraite anticipée sans activité secondaire ? Nous analysons si vous pouvez réellement prendre votre retraite anticipée en Suisse avec un salaire normal sans créer de blog ou d’entreprise.
Tout ce que vous devez savoir sur l’étude Trinity
La règle des 4 % expliquée. Découvrez la célèbre étude Trinity, comment elle a déterminé les taux de retrait sûrs et ce que cela signifie pour la retraite anticipée.
Apprenez des moyens faciles d'optimiser vos finances et d'économiser des milliers de francs en Suisse avec notre e-book exclusif. Découvrez les services financiers les plus rentables adaptés aux résidents avisés et aux expatriés!
Obtenez votre guide suisse d'économies GRATUIT
C’est bon, j’ai tout capté. Merci d’avoir mentionné le « risque de séquence de retours ». J’ai relu ton article à ce sujet (https://thepoorswiss.com/fr/risque-sequence-rendements/) et c’est la pièce du puzzle qui me manquait. Tu devrais faire un lien entre tes 2 articles, ça aidera beaucoup tes lecteurs. Encore merci pour ta patience.
Super :)
Excellent point, je vais ajouter un lien, ça va aider en effet!
Bonjour,
merci pour cet article. Si on est investi 100% actions, le conseil serait de passer à 20% obligations et 80% actions combien de temps avant la retraite? Pour ensuite être à cet exposition au début de retraite et faire un equity glidepath de 80 à 100% au cours de la retraite.
Les obligations sont aussi soumises à changement de cours, comme lors de l’inflation comme actuellement, donc cela peut ne pas forcément être une protection si le marché est baissier + inflation, c’est juste?
Dans un des articles du blog sur comparaison obligation-cash, il était finalement conclu que cela valait aussi de finalement garder ce « 20% » par exemple en cash au lieu d’acheter des obligations.
Les obligations qui ne sont pas sur le cours du marché et sont redonnés au même montant après le temps prévu sont difficiles à acquérir car chère à l’achat et peu disponible pour les particuliers ou je me trompe?
J’avais lu dans un article que l’argent du 2e pilier peut être considéré comme une obligation donc à compter en pourcentage dans son allocation totale. Cela représente en principe une grande somme.
Bonjour Mel,
Alors, ça n’est pas strictement nécessaire de faire un glidepath. C’est possible de faire 100% en actions à la retraite, le problème étant les risuqes les premières années.
Mais si vous voulez passez de 100% en accumulation à un glidepath 80->100 à la retraite, c’est suffisant je pense de changer le jour de début de la retraite.
C’est correct que les actions ont leur propre risques (surtout les fonds en action).
Garder 20% en cash n’est pas une mauvaise idée non plus. On pourrait d’ailleurs faire un glidepoath en cash également.
Non, vous ne vous trompez pas. Les obligations de caisses vendues par les banques sont souvent très inférieures aux taux directeurs et du coup peu efficaces malheureusement.
En effet, je considère le second pilier comme des obligations. Mais il ne faut pas oublier que le jour ou vous touchez le second pilier, vous allez devoir l’investir et du coup, ça ne sera plus 100% en actions.
Bonjour Baptiste,
Merci pour cette article fort intéressant mais une chose m’échappe. Quel est le réel intérêt du glidepath? Je veux dire, on sait déjà qu’un FIRE a plus de chance de succès en se rapprochant d’une stratégie 100% actions toutefois une part d’obligation (20% par exemple) permet de limiter le risque d’effondrement du marché et une perte de notre capital. Du coup, de mon point de vue, le glidepath est juste un changement de stratégie en fonction de notre aversion aux risques mais je ne vois pas l’intérêt de modifier la répartition des actions au fil du temps. Autant faire la modification en un coup et passer en 100% actions et dès aujourd’hui, les chances de succès du FIRE serait bien plus élevées.
Bonjour Greg,
Comme tu l’as dit, les actions permettent de tenir plus longtemps à cause de leurs performance et les obligations permettent de se protéger contre les risques.
Ce qui est important, c’est que le risque majeur est un gros effondrement des actions au début de la retraite (5 premières années environ). Après ça, c’est moins risqué car le capital aura probablement déjà augmenté.
Avec un glidepath, tu commences avec des obligations les premières années. Elles te protègent donc en cas de gros crash et petit à petit, tu les convertis en actions, ce qui va augmenter ta performance pour le long-terme.
Du coup, tu profites des obligations et des actions au bon moment.
Bonjour Baptiste,
Merci pour les infos supplémentaires. Je crois avoir saisi l’info qu’il me manquait. Il vaut mieux partir en early retirement avec 20% d’obligations que 100% actions.
Mais Il y a toujours une part du concept qui m’échappe.
je comprends très bien le risque d’effondrement des actions mais quand on est en early retirement, le risque est présent et impactant pas seulement les 5 premières années de early retirement mais sur plus de temps. Imaginons un départ en early retirement à 50 ans (ce qui est mon objectif), un effondrement de la bourse à mes 55 ans ou 60 ans sera très impactant sur mon capital et mon taux de retrait (Note: Je ne considère pas la période au delà de mes 65 ans car je devrais toucher en plus le 2ème et 3ème pilier en rente ce qui sera une sécurité supplémentaire en cas d’effondrement du marché). Et faire du glidepath à des taux de 0.1 ou 0.5 par mois me semble trop timide, la crise sera déjà passé avant d’arriver à 100% actions…et une nouvelle crise arrivera à ce moment là, damned!
Bien entendu, le risque est toujours présent. Mais il est bien plus grand au début parce que votre portefeuille va grandir.
Si les 5 premières années vous avez 10%+ de perforamnce par année, et après vous avez un crash, vous êtes dans une bien meilleure situation que si le crash arrive la première année. C’est ce qu’on appelle le risque de séquence de retours.