Updated Trinity Study for 2026- More Withdrawal Rates!
| Updated: |
(Disclosure: Some of the links below may be affiliate links)
Would you like to know precisely which withdrawal rate is safe and will sustain your lifestyle for a long time?
You will find the answer in this article, with updated results from the Trinity Study! This study researched different withdrawal rates for retirement. Although the original research was not about early retirement, it is often referred to in the Financial Independence and Retire Early (FIRE) movement!
However, there are two caveats to the original study. First, they are only covering the period until 1995. And then, they are not covering more than thirty years of retirement. Thirty years is not enough for some people wanting to retire early.
Therefore, I reproduce the original study’s results with recent data all the way to 2025! And I extended the data back to 1871. This makes for much more data than the original study.
I have also considered periods as long as 50 years. It means many more withdrawal simulations than the original study.
In this article, you will find how I did it and all the results I have gathered from this data!
The Trinity Study
I have already talked at great length about the Trinity Study. It is an excellent research paper done by three professors from Trinity University.
Their research paper’s goal was to see which withdrawal rates people should use to sustain a particular lifestyle for up to 30 years. It is important to note that the original research was not about early retirement but official retirement.
It is important to emphasize that we are talking about sustaining a lifestyle (expenses), not capital. So, if you end up with 1 USD at the end of the retirement period, this is a success. If you want to sustain your capital in retirement, it is a different success criterion not treated by the original Trinity study.
They tested the success rates of withdrawal rates from 3% to 12%. Furthermore, they tested portfolios with between 0% and 100% stocks by jumps of 25%.
The authors also took inflation into account in the results. Indeed, it is interesting to compare the results with and without inflation. Finally, they also provided the terminal values of the portfolio.
I wrote a detailed article about the Trinity Study if you want more information.
The 4% Rule (of Thumb)
The Trinity Study is the source of the 4% Rule. This rule states that if you only withdraw 4% of your initial portfolio yearly, you can sustain your lifestyle for a very long period. And your withdrawal is adjusted for inflation every year.
Some people believe that the original study shows that this will sustain forever. But this is not what the original research was about. They only tested simulations for up to 30 years.
It is better to call it the 4% Rule of Thumb. Because if you plan to retire very early, you will probably need a lower withdrawal rate. Moreover, your withdrawal rate will depend on your portfolio and asset allocation to stocks and bonds.
Why did I do it again?
If the study is excellent, why did I want to redo it? I have several reasons for that.
First, I wanted to see how this worked with recent stock market returns. The original study was only covering years up to 1995. I wanted to have more recent data. I wanted to ensure the results were holding with more recent stock market behavior. So this simulation will cover returns until the end of 2025!
Secondly, the original study only covered up to thirty years of retirement. I wanted to ensure that the portfolio could sustain withdrawals for extended periods. For people retiring early, I think that 50 years is not unreasonable.
Finally, I have to admit that I like to write code. So it was cool to write code related to this blog. And being a big geek, now I can run many simulations with the data I want. Overall, it was a lot of fun preparing the data for this article.
Ultimately, I want to extend the Trinity Study to the European markets. It will be challenging to obtain the data. But I will try to find it for as many years as possible.
How I redid the Trinity Study
My simulation uses monthly withdrawals. Most people in retirement will withdraw money monthly. It is also possible to withdraw money at the end of the year instead. But I believe that it is not common.
I have calculated all the returns monthly. Doing that makes the results much more accurate than doing it yearly. And the monthly withdrawal is updated with inflation every month as well. Every possible starting month in the available data is tested.
For this simulation, I have not done any rebalancing. For more information, I have compared different rebalancing methodologies for retirement.
Withdrawals are based on the current allocation. For instance, if your base allocation to stocks is 60%, but your current allocation is 80%, 80% of the withdrawal will be taken from stocks. If you are interested, I have explored other techniques in other articles:
Based on this simulation, I collected the same results as the original study: success rates without inflation, success rates with inflation, and terminal values.
Success rates of the Trinity Study
I start the simulation with the entire data from 1871 to 2025.
In this simulation, success is when your portfolio does not run out of money before the end of the simulation. For instance, if we simulate for 20 years and end up with one dollar after 20 years, it is a success. This is a failure if the portfolio runs out of money before that (it could be in the first year or the nineteenth year).
So, the success rate is the percentage of the months that end up with success. The higher the success rate, the better the results are.
We will see what success rates we have when we ignore inflation. We start with 20 years since I do not think anybody will care about a ten-year-long simulation. I will begin at a 3% withdrawal rate and go up to 12%, increasing by 1% at a time.
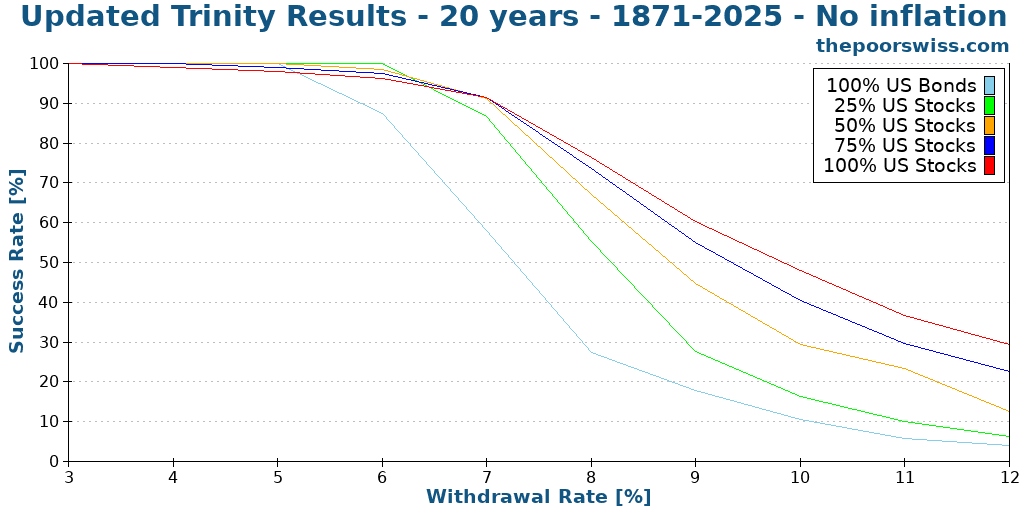
We can see what we already expect:
- Increasing the withdrawal rate decreases the chances of success
- Any withdrawal rate higher than 8% does not make sense long-term, even without inflation.
- A small allocation of bonds can help with lower withdrawal rates
- Generally, a 100% stock portfolio will perform better than the other portfolios.
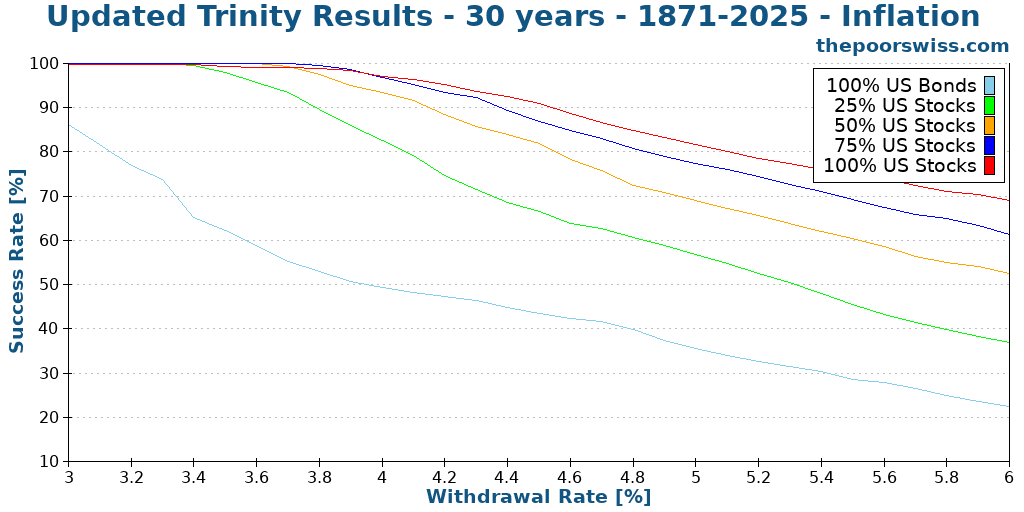
Here is what happens when we push the simulation to 30 years.
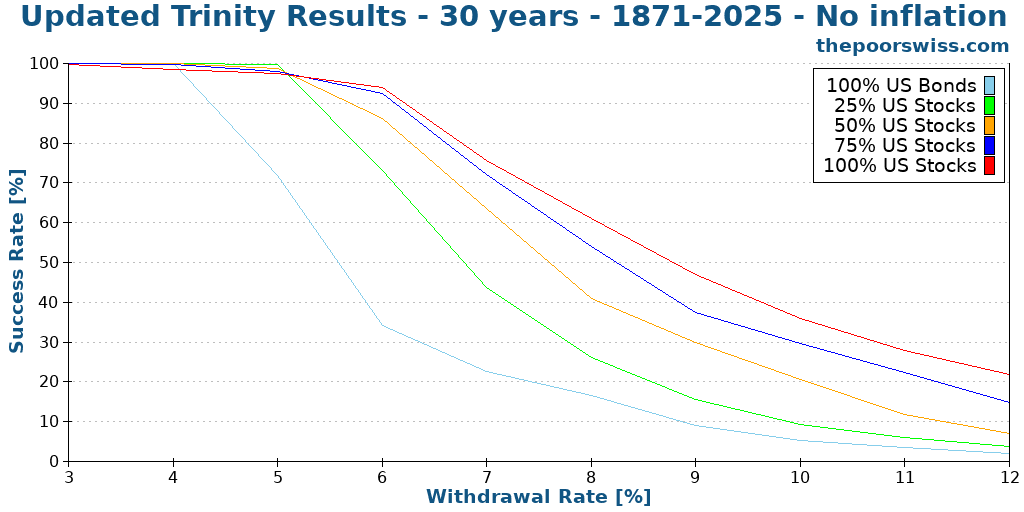
We can see that increasing the number of years decreases the likelihood of success. It is logical since you are more likely to run out of money.
With 30 years of retirement without inflation, a 6% withdrawal rate with a significant allocation to stocks still makes a lot of sense!
Taking inflation into account for retirement
However, it is much better to consider inflation in our simulation! We start again with 20 years to compare the results:
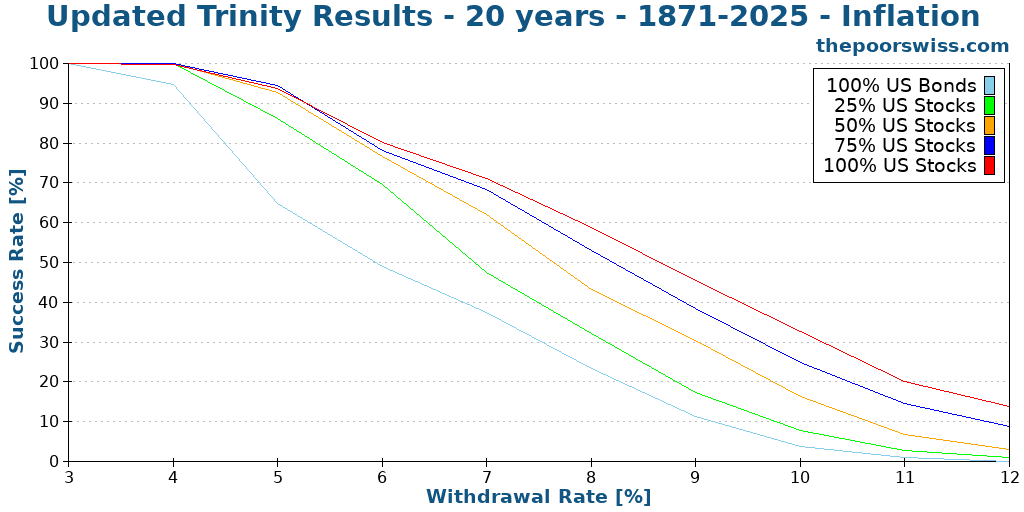
As we can see, inflation causes a significant hit to our chances of success! Before inflation, an 8% withdrawal rate made some sense. Now 6% is the limit. And even 6% has a barely over 75% chance of success!
Here is what happens for 30 years of retirement.
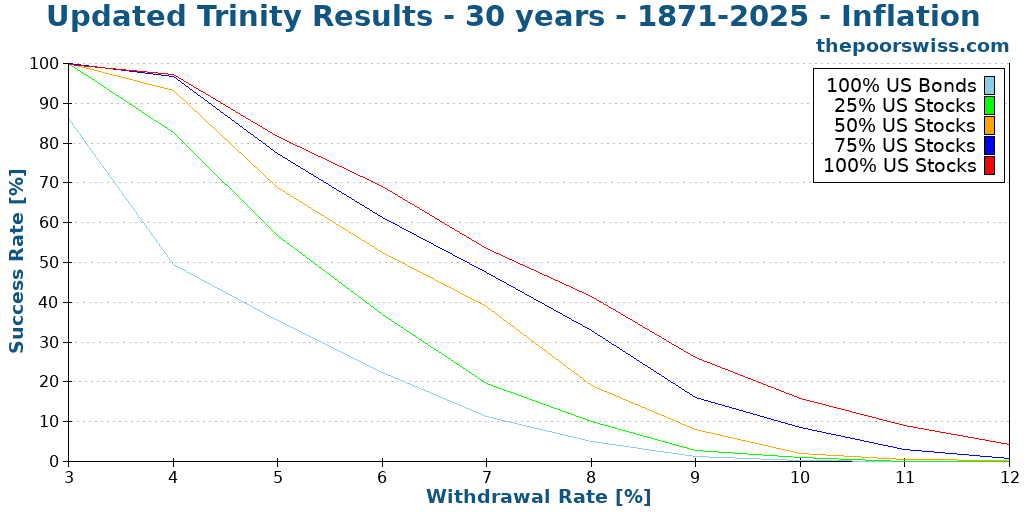
We can now see that anything higher than a 6% withdrawal rate is hazardous, with a less than 75% chance to succeed even with 100% stocks.
More withdrawal rates
Since we see that reasonable withdrawal rates are in the range of 3% to 6%, we try more withdrawal rates. I have simulated increments of 0.1% of withdrawal rates.
With a large stock allocation, withdrawal rates between 3% and 4% are very safe. Some people would even dare use withdrawal rates of about 4.5%. But even a portfolio with 100% stocks has only an 85% chance of success after 30 years with 4.5%.
Longer retirement time
One of the caveats of the original study is that they stopped at 30 years. We run the same simulation again but with 40 years this time.
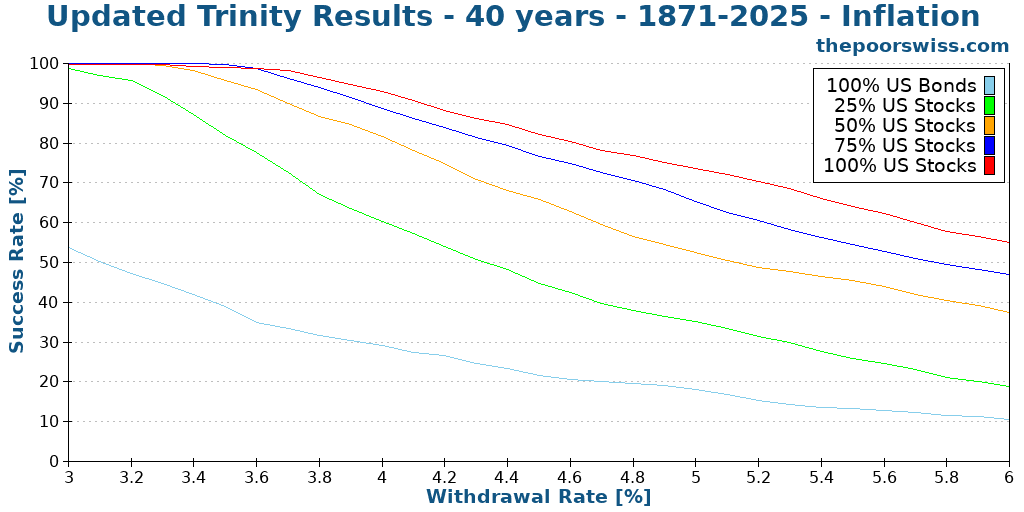
After 40 years, we are starting to see lower success rates, even for most people’s 4% withdrawal rate. Unless you have 100% of stocks, your success rate will be less than 90%.
Here is what happens in 50 years.
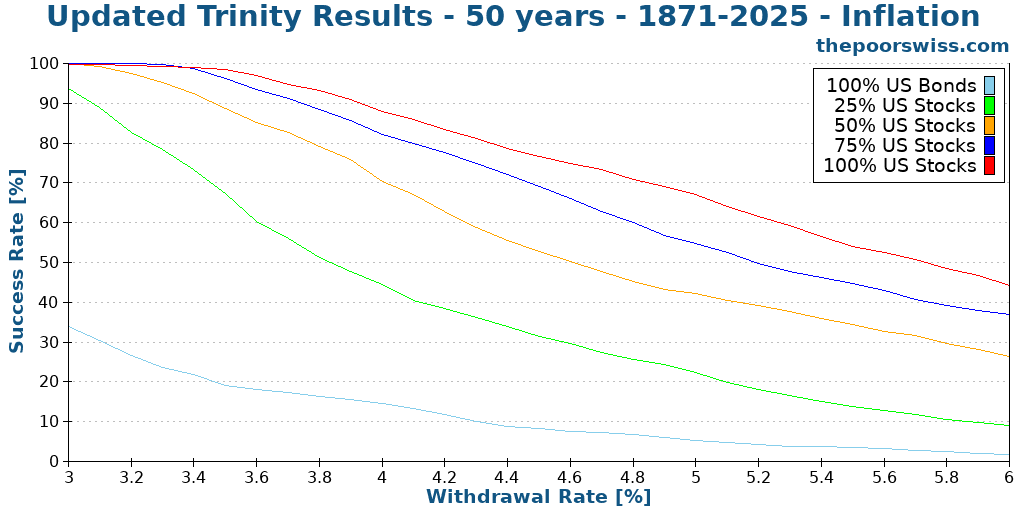
As expected, we see lower success rates. But it is still not bad at all with reasonable withdrawal rates. A 100% allocation to stocks and a 3.5% withdrawal rate still have more than a 98% success rate. This is significantly more than I expected.
It shows that the study’s original conclusion can still hold for over 30 years. It is excellent news!
Updated Terminal Values
Another interesting thing from the study was that they also compared the terminal values of the different withdrawal rates and portfolios.
So we will see the terminal values of a 1000 USD portfolio after 30 years. I did the simulation for a portfolio of 100% stocks. For the sake of display, I have reduced the number of withdrawal rates.
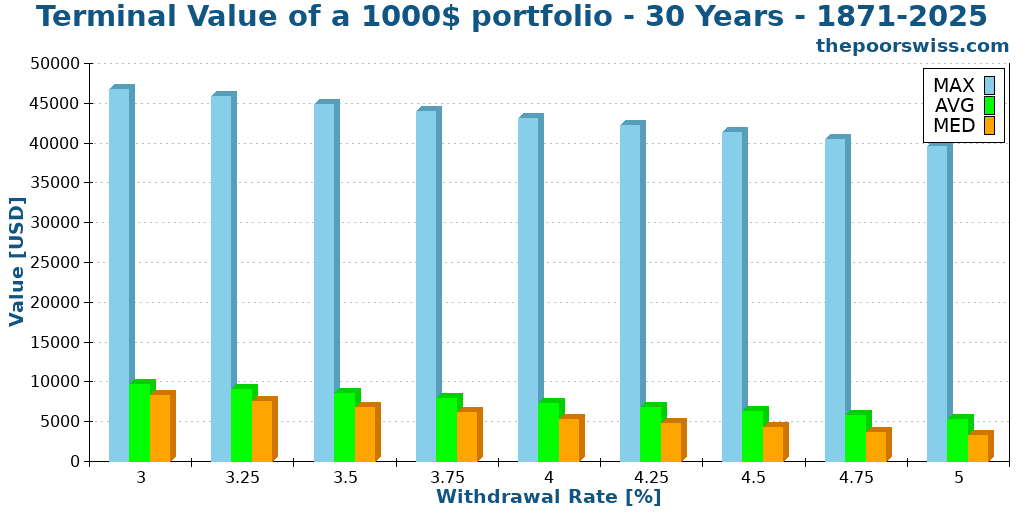
I did not show the minimum values. Indeed, they are always zero. If the chance of failure exceeds zero, the minimum value will be zero.
However, the average and median values are quite remarkable. We will focus on the median since it is generally more representative than the average.
For a withdrawal rate of 3.5%, my current target, the median terminal value after 30 years, is about 6700 dollars! Not only did your portfolio sustain your lifestyle, but it also increased sixfold! Let me repeat this. After 30 years of doing nothing but withdrawing money, you have six times more money than when you started!
The maximum values do not mean a lot. But it is crazy to see that after 30 years, you could have about 30 times more money than when you started! And this is with a 3.5% withdrawal rate!
Here is what happens when we extend it to 40 years.
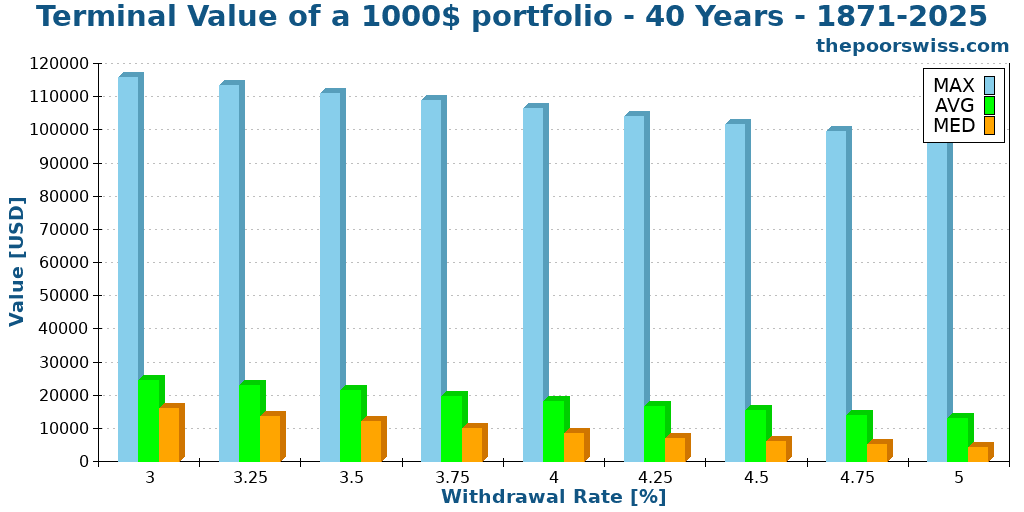
We can see that the results are comparable. However, all the values are significantly higher. The numbers are all about twice higher. On average, your retirement money will double during the ten additional years. So, even though you are not contributing more money and living from it, your portfolio will double in 10 years. How cool does that sound?
The success rate is not everything
There is something important with these measurements: the success rate does not tell the entire story. For instance, for you, which of these two scenarios is better?
- 98% to last 50 years, but a chance of running out after ten years
- 96% to last 50 years, but a chance of running out after 48 years
For me, the second scenario is better. You do not want to have a chance of failing after only ten years if you are planning for 50 years. But if it fails after 48 years, you have many years to make some adaptations.
So, another essential metric is the worst duration of a scenario. This means after how many months, the first failure can happen.
For reference, here are the success rates of each portfolio for 50 years and different withdrawal rates:

And now, here are the worst durations for each of these portfolios:
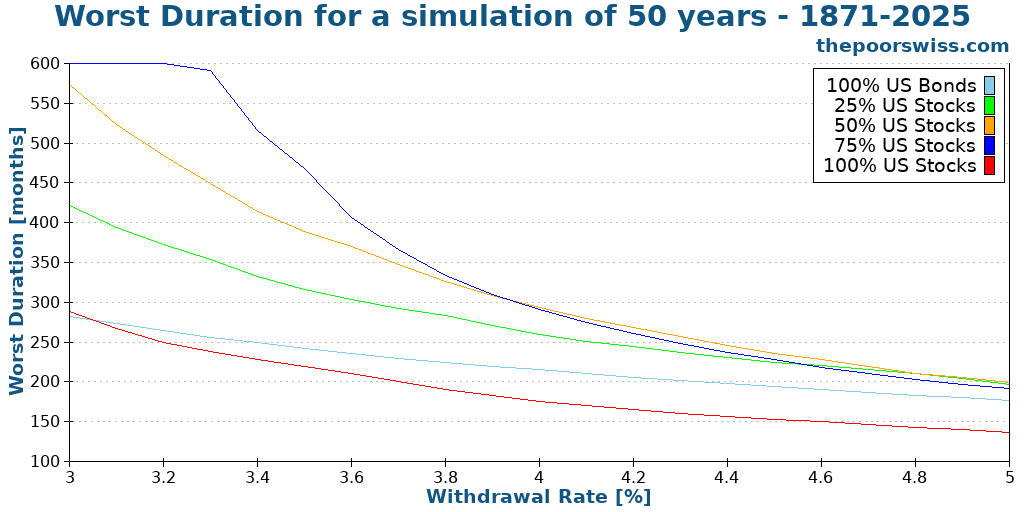
If we only look at the first graph, the conclusion is that higher allocation to stocks is always better. But if we look at the second graph, 100% stocks is the worst one!
So what does this mean: you need a balance in your portfolio. Bonds will significantly reduce the chances of your portfolio failing too early. This does not mean that you should optimize for the highest worst duration either. Because if your highest duration is 40 years, but you have only a 50% chance of reaching 50 years, this is gambling, not planning.
So balance is essential. While stocks will increase your success, stocks are more subject to sequences of return risks.
How to implement the Trinity Study?
Now that we have noted that the results of the Trinity Study are encouraging and would let people retire early, how should we implement it?
Theoretically, the Trinity Study is based on a simple concept: you can retire based on a large principal by withdrawing with a fixed withdrawal rate.
However, in practice, this means you need to accumulate money, more than most people accumulate during their lifetime. And you need to accumulate this earlier than retirement age.
To accumulate this money is not easy, but it is also not complicated. First, you have to save money (as much as possible). For this, you will have to focus on your expenses and earnings.
Then, you will have to invest that money until you can retire. Once you have accumulated the proper amount through capital gains and savings, you will be financially free.
If you are interested, I have many articles on my blog about financial independence.
How did I do it?
You can find my code and my data on Github. Everything is available to share as much as possible!
I wrote the entire program in C++. I used this programming language because it is my favorite! And it is blazing fast! I have not especially optimized my code, and it takes less than a second to generate thousands of simulations.
If you are not a coder, I also have an online FIRE calculator to do most of the calculations presented here.
My U.S. and international data is based on the data made available by Big ERN in its Safe Withdrawal Rate series. It is a good dataset that has been tested several times already. Big ERN made all this available for free. I am thankful for his work! I have completed its data with the missing years using the same methodology.
If you want to use the graphs in this article, please cite this article as the source of the image!
Future of the series
It was fascinating to reproduce these results. And it was very insightful as well. I have learned many things from the results. It is great to see the confirmation that the original conclusions hold for more than 50 years.
And it also shows that my withdrawal rate (3.5%) is a safe bet. I may switch to 3.75% in the future. I will have to run more simulations. It is important to choose a proper safe withdrawal rate.
Talking of simulations, I have run a few more simulations with the same idea:
- Trinity Study Results with Swiss Stocks
- Withdrawal rates and low-yield bonds
- When should you rebalance your portfolio?
- Does the Trinity Study work in recent years?
- How often should you withdraw money?
- Can you retire early with Swiss stocks and bonds?
- The Trinity results with world stocks
- Equity glidepaths in retirement
Since I plan to make more articles like these with more simulations, I would like to get your perspective on this article! Please let me know what you think in the comments below! What should I improve?
What do you think of these results? Would you like me to run more simulations like this? Do you have ideas on what kind of simulations I should run next?
Conclusions
With all these results, we can have several important conclusions.
First, the paper’s original conclusions still hold even with much more data being considered. And it still stands accurate up to 2026! It is excellent since it shows that the 4% rule of thumb still works!
If you increase the simulation time to more than 30 years, a 4% withdrawal rate is no longer safe. With 50 years of retirement, you have a 90% chance of success with a 4% withdrawal rate at most. A withdrawal rate of around 3.5% would be safer for most people.
If you want real chances of success, you will need more than 50% of your portfolio allocated to stocks. The stocks allow us to fight inflation and cover the withdrawal rate year after year.
If you choose a reasonable withdrawal rate, you will likely have much more money than when you started! For instance, a 3.5% withdrawal rate over 30 years with 100% stocks would leave you about six times more money than when you started!
For information about the original study, read my detailed article about the Trinity Study. If you are extremely conservative, you will also be interested in learning how to choose a failsafe withdrawal rate.
If you want to start investing to become financially independent, you will be interested in my guide on how to get started in the stock market.
More reading

Why do so many software engineers choose FIRE?
Tech and FIRE. Explore why so many programmers and software engineers are drawn to the Financial Independence, Retire Early movement.
Retire Early: The Simple Guide – I wrote a book
I wrote a book, Retire Early: The Simple Guide, with Thomas Walke, another Swiss blogger. Our book is about the basics of early retirement.
Out of The Rat Race – Financial Freedom – Book Review
Out of The Rat Race is a good book by Eric Duneau that tells how to achieve Financial Freedom by leveraging Real Estate properties, with low savings rate.
Learn easy ways to optimize your finances and save thousands in Switzerland with our exclusive e-book. Learn about the most cost-effective financial services tailored for savvy residents and expats!
Get Your FREE Swiss Money-Saving Guide
Hi there The Poor Swiss!
First post I read on your site – I was looking for the original Trinity Study to read up on it and be able to detail their original criteria for creating the “4%” rule. As a novice coder myself (did a good amount of C++ in high school), I found it absolutely amazing that you were invested enough to start building some simulations yourself. Makes me wonder how good my coding is after all these years.
Thanks for running the numbers for us! I’m not financially independent yet, but right now looking at being there in about 10 years based on a 3.5% SWR.
Thank you!
Hi Money Quirk,
Coding is like cycling, you do not forget it ;)
I am glad you found this useful! It’s actually not that difficult to code. There is no real challenge in doing it. But it does take some time.
Good luck becoming FI!
Mr. Swiss,
Awesome piece of work!
Have you tried a simulation using a dynamic withdrawal rate? Perhaps a uniform life expectancy table. Your spending will vary year by year. But you could add some kind of guardrails (max Y/Y %increase and decrease).
Hi Kevin,
Thanks :)
No, I have not tried. But one thing I definitely want to test is with a fixed withdrawal rate based on the portfolio. For instance, you always withdraw 4% of your portfolio regardless of how big (or how small) it is.
Guard rails are also a good idea!
I will take this into account for my next simulations!
Any other idea I can play with?
Thanks for stopping by!
Hi,
great work mr Swiss! but the main thing I am wondering is how much the past results (of the SP500) are applicable to the future expected returns. Past SP500 results are based upon the dividend returns of the past, the inflation and bond yields, and economy growth. We know that yields are a lot lower the last decades (from 4-5% and more before 1970 to 2.5-3% the last decades), inflation is lower, bond yields are much lower, and growth is continuously slowing down in the developed world. All this impacts investment returns (mostly negative). A simple proxy for stock returns is growth + dividend yield + inflation (or growth + yield nominal).
And of course tax regimes are country dependent and frequently changing. I would be very interested to see simulations which take all these factors into account, we are kind of looking at fake predictions for withdrawal rates if we use 1900-1970 data to predict the economy and stock market in 2020-2060.
Hi ROL,
That’s a good question. There is no way to tell how much the past results are applicable to the current situation. Past performance is the best we can do. If this worked in the last 150 years, this is a good enough indicator (for me at least) that something is working.
With lower yields, the bonds will perform worse than before. But the low inflation will help your portfolio. As for stocks, they may slow down a bit (but they haven’t slowed down yet).
There is no good proxy for stocks. And there is no good evaluation for growth in the future either. I do not see how I would take this into account in a simulation.
I do not think this is a fake simulation. This is an average of all the possible 30y (or more) periods in the past. This includes times such as the great depression, the great recession, and the dot-com bubble.
I plan to try to do a simulation with (fake) low yields in the future.
If you have a suggestion for a feasible simulation, I am going to add it to my list :)
Thanks for stopping by!
Hello MPS
Nice post, even after reading big ERN’s work (which I find wonderfull if you live in the US). The thing that get’s overlooked here is currency fluctuations: when I was born, the FX-rate CHFUSD was at 4.8 to 1. Now we’re below 1:1… So for the Swiss investor, the FX-rate would have been devastating.
Well, I think ROL has a point there. I we assume that due to lower global population growth (as projected by the UN) leads to lower economic growth, this would also affect equity returns.
So instead of working with past data, wouldn’t it be nice to calculate success rate for the different SWR using different average returns (4%/ 5%/ 6% p.a.etc)?
The other thing I want to point out: there’s a myriad of data out there. The SNB has inflation data on their website (https://www.snb.ch/de/iabout/stat/statrep/statpubdis/id/statpub_histz_arch#t2). The longest data for Swiss equity gets published by Pictet, I believe it starts 1926. Gold could be found here (https://www.gold.org/goldhub/data/gold-prices).
Keep up the good work – cheers
Hille
Hi Hille,
That’s a very good point about currency fluctuations. Actually, I did the simulation again with Swiss stocks, swiss inflation, and currency exchange rate: https://thepoorswiss.com/4-percent-rule-swiss-stocks/
And you are right, taking into account a difference of 5:1 to 1:1 makes a huge difference. However, I do not think we are going to see that again. The difference came from the end of the gold standard and of the Bretton Woods System.
But we will see how it goes :)
Thanks for stopping by!
Hi MTPS,
Great article! When you analyzed safe withdrawal rates for a stock portfolio were you assuming that the stock portfolio was only comprised of US large cap stocks (like an S&P 500 index fund), or did you include US mid and small cap stocks and foreign stocks (from both developed and emerging markets)? Did the original Trinity Study define stocks (for their study) as a stock portfolio that is solely comprised of US large cap stocks?
Hi DND,
That’s an excellent question!
All my U.S. Stocks data are based on the S&P 500 returns. So no mid and small-cap.
And the original Trinity Study also use the S&P 500
If I find the data, I want to rerun this for small-cap and mid-cap. That would be awesome!
Thanks for stopping by!
Phenomenal analysis and thank you for making the original Trinity study more current with these results.
I am likely in the 40 year retirement range (like to retire in 5 years at 53) and have been using 3.5% as my target but that was because I am conservative and I don’t want to ever be forced to work again once I pull the plug (I am a physician and it is tough to re-enter the medical field if you are out for a # of years).
I too would like to see various portfolios (50:50 stock/bond and go in increments of 5 all the way to 100:0).
Also because in the US (and probably globally) we are in a very low interest environment (I know of some countries that are negative interest rate) what do you think changes if you look only at more recent data?
Hi xrayvsn,
Your logic makes a lot of sense! Taking into account the difficulty of going back to work is very smart!
I will definitely try to have more portfolios the next time I do this!
I think it is a very interesting question. For now, on the data, there are too few years with very low-interest rates. I could try to run the simulations with setting a low-interest rate for bonds. That is an interesting experiment!
Thanks for stopping by!
I love this post! Glad I found your site through PoF. I wish I knew how to write code. Perhaps that will be a project for retirement. I have come up with a withdrawal strategy (I just modified a few of my favorites) and back tested them as best I could- they look great so far but not done playing with them yet. Thanks for the useful info!
Hi, She’s FIRE’d,
I am glad you found my blog :)
Learning to code is an interesting project for retirement indeed :)
Very good that you are back-testing and playing with your withdrawal strategy!
Care to share your withdrawal strategy?
Thanks for stopping by :)
As is seems 100% stocks gives better results than 75% stocks in the long run, could you also look at 90/10, 80/20, 70/30 and 60/40 splits to see if one of these is even better than 100% stocks?
I’m especially interested in how they turn out if you include yearly rebalancing.
Great work BTW!
Hi Peter,
I have done the experiment with rebalancing. It should help a bit!
For this article, I only include the allocation used by the original study. I may do more portfolios in the future.
Thanks for stopping by!
Hi,
Thank you for this update!
Is it possible to run a simulation over 20 or 30 years with a specific withdrawal rate for each year. I also have several moments in time where I would start withdrawing from multiple account. Is it possible to add these into the simulation?
Greetings from the Netherlands!
Hi Stefan,
I am not sure I understand. Do you want to change the withdrawal rate each year? Why would you like to do that?
For now, I cannot handle multiple portfolios. I cannot run every single possible combination of simulation ;)
Thanks for stopping by!
This is a great article, really insightful and interesting to do this kind of study over a recent time period indeed. It’s quite crucial to know what is the current success rates, without blindly assuming that historical results will still be valid today!
Hi, Radical FIRE,
Thank you for your kind words!
Talking about recent times, I plan to do the same study with only 50 or 60 most recent years to see if there is a difference recently.
Thanks for stopping by!
Danke für die ganze Mühe mit dem Datensammeln!
Mich würden Zahlen in Zusammenhang mit der Rentenbesteuerung interessieren: Wie hoch ist der jeweilige Anteil an ursprünglich eingesetztem Kapital (bereits versteuert) und Kapitalertrag (Zuwachs, muss bei Entnahme versteuert werden) an der monatlichen Entnahmerate?
Zweite Frage:
Könntest Du mal diesen Beitrag https://frugalisten.de/entsparen-shiller-cape/ lesen und eine Berechnung mit Entnahme nach dem Shiller CAPE laufen lassen? Oder ist das zu kompliziert?
Dankeschön für die interessanten Auswertungen!
Sorry Christine, but my German is really too bad to answer you or read the article you sent. Feel free to ask in English.
Sorry, I thought you lived in the Schwiitzerdütsch speaking part of Switzerland.
No :) But that’s a mistake many people do. My Schwiitzerdütsch is even worse than my German ;)
Thanks for the nice article. Especially the easy cmparison of different bond/stock ratios and their performance over a longer timeframe is interesting.
I think the question above was related to a dynamic spending model and if it woul dbe possible to include that in the coding. The CAPE model is an even more advanced strategy which also includes a smoothed PE ratio of the stock market by whch the dynamic spending scheme is further optimized.
But maybe we are at the point of “oversimulation” here :)
What is not included in almost any calulator is the tax effect. And at least in Germany that´s massive. Most studies don´t include it, because it is different for every person and every country, so it is very hard to simulate. But maybe a simple fixed correction factor for tax on dividends and stock gains may be possibe.
Hi Senior Crown,
Thanks :) I am glad you like this article!
Backtesting a CAPE-adjusted portfolio would definitely be interesting! And other kinds of adjustments would be interesting as well. I want to try to do that if I get the time.
It would definitely be interesting to take into account dividend taxes and capital gains taxes. But as you said, it would be very difficult since it would depend on the marginal rate of each person. It could make sense in a calculator but not in a broad article like this one.
And another problem would be the data. The historical data includes directly the dividends into the value of the funds. This means that we do not know how much of the gains are dividends and how much are capital gains. But it is probably possible to find this data with more details about distributions. I will try to think about it.
Thanks for stopping by!
“we do not know how much of the gains are dividends and how much are capital gains.”
This is easy in Germany: We pay tax on everything :)
Honestly, that´s the reason, why there is only a very small group of people attracted to FIRE in Gernmany compared to e.g. the US. We are just taxed to death, which makes it so much harder to have progress.
Their next move is to have additional tax whenever you buy or sell stocks. Tax on air (CO2) and tax on electrical power that you produced with your own solar panels (EEG) is prepared as well – I´m not joking.
What I do as a rule of thumb, is to multiply any number by 0,73 to correct for the “Quellensteuer”, although that is also flawed by neglecting compunding effects etc. but at keast t gives a rough idea.
Hi Senior Crown,
It’s easier indeed to compute, but you probably end up with significantly more taxes! The fact that we do not pay capital tax gains in Switzerland is a great thing.
Are they really preparing a tax when you buy and sell stocks? On top of capital gains, it does not make sense…
Tax on the electrical power from solar panels is quite sad in the current state of things :(
Thanks for sharing this!