How often should you withdraw money from your portfolio?
| Updated: |
(Disclosure: Some of the links below may be affiliate links)
I have recently done simulations of how often you should invest to maximize your gains. And I thought it would also be interesting to simulate how often we should withdraw money from the portfolio while in retirement.
If you are retired and living from your portfolio, you will have to withdraw money to pay for your expenses. You have to sell shares and use the proceeds to live.
But how often should you do that? Does it even matter (hint: it does!)? This is what we see in this article. I use historical to simulate different withdrawal frequencies for different Safe Withdrawal Rates.
Withdrawing Frequency
I will assume you are familiar with the Trinity Study and how to retire based on your portfolio. Otherwise, you should read the previous article and come back here.
When you live from your portfolio based on your Safe Withdrawal Rate, you will sell your shares from the stock market and live from this money.
There are two main strategies for withdrawing:
- Sell enough shares at the beginning of the year to cover an entire year’s expenses.
- Sell enough shares at the beginning of each month to pay your bills.
People making yearly withdrawals argue that this way is safer from large stock market movements during the money since the money is out of the market. People making monthly withdrawals argue that this is more effective since they keep their money in the stock market as long as possible.
So, who is right? That is what we will find out.
Simulations
I will run simulations based on the Trinity Study with different withdrawal rates and different withdrawing frequencies. For this, I use data from the U.S. Stock market from 1871 to 2024. The withdrawals are taking U.S. CPI inflation historical data into account as well. In all my simulations, I assume a TER of 0.1% per year.
I am using my tool to do these simulations. If you are interested in the tool and the data, you can look at my Updated Trinity Study article.
The output of the simulation is the success rate. Success is simply defined as not running out of money before the end of the simulation. If you end up with 1 CHF at the end of the simulation, it is still a success. And the success rate is how many simulations succeeded in the given period compared to the total number of simulations.
Fun fact: I have run several million simulations for this article!
Retirement of 20 years
We start with a retirement period of 20 years. Your retirement is successful if you still have money after twenty years. I use a 4% withdrawal rate for this simulation.
Here are the success rates for different withdrawing frequencies and different portfolios:
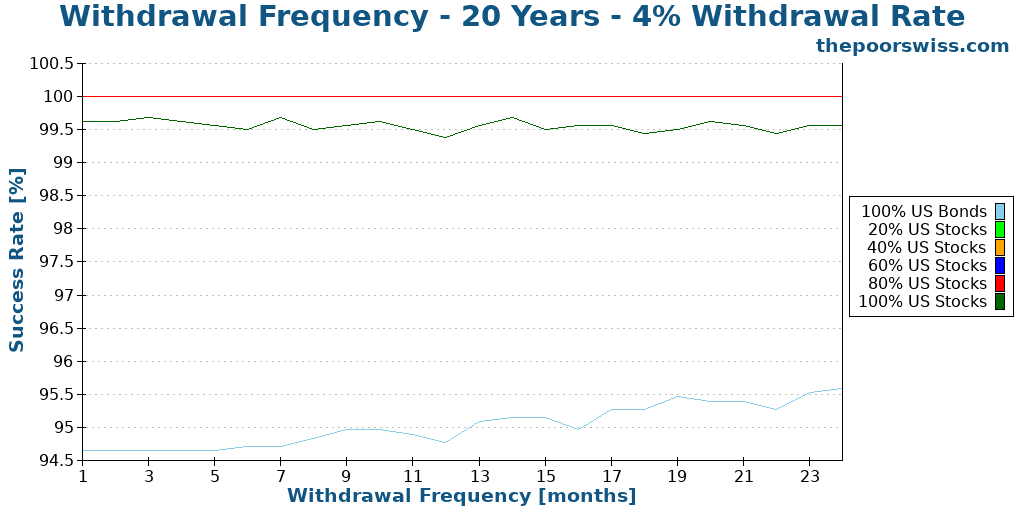
Over 20 years, these simulations are not very interesting. You have a very high chance of success. You could use a higher withdrawal rate and still be fine. But we mostly talk about early retirement, so 20 years is a short time.
But back to the subject of withdrawing frequency. Interestingly, we can see that the less frequently you withdraw with a 100% bonds portfolio, the higher your chances of success are. I was not expecting this. We generally want to keep the money in the stock market for high returns. But if the returns are not high, it should make less of a difference.
For all the other portfolios, the differences are not significant with withdrawing frequency. So, we need to increase our retirement period to see if something is interesting.
Retirement of 30 years
We continue with the same simulation but for 30 years. This starts to resemble early retirement. Here are the success rates in this simulation:
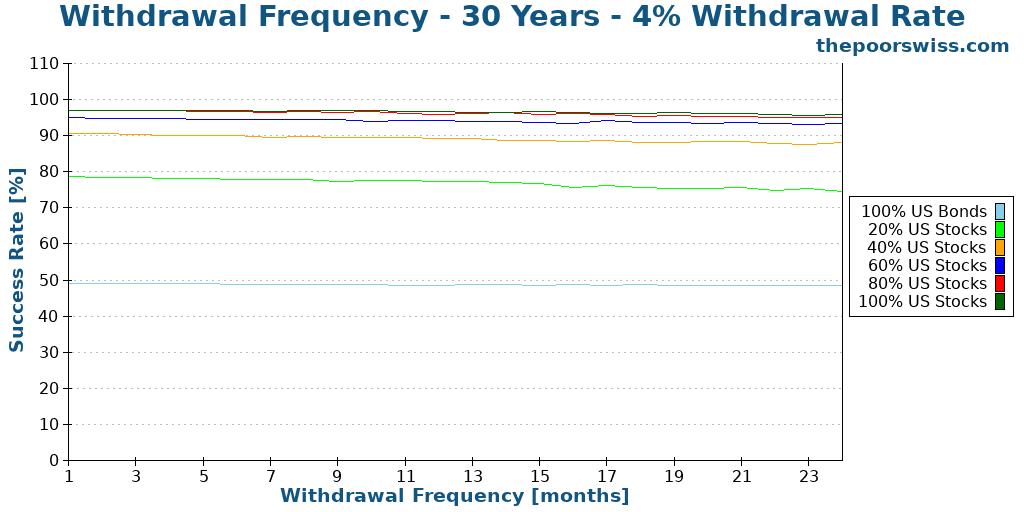
Over 30 years, the results look more interesting already. There is some clear difference between the different portfolios and the different withdrawing frequencies.
Since the 100% and 80% bonds portfolios are too conservative for a 30 years retirement, we remove them to have a better view of the other portfolios.
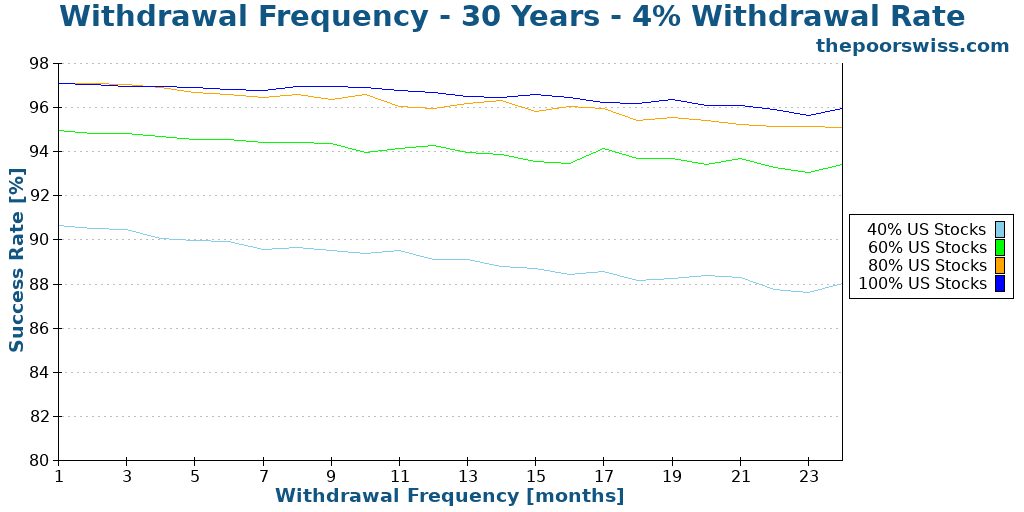
Now, we can see better! And we can see a significant difference between the different withdrawal frequencies. For all the portfolios, on average, a more frequent withdrawal strategy yields better results!
On average, over 30 years, you would reduce your chances of success by 2% by withdrawing every two years instead of every month. If you withdraw every year, you would only reduce your chances of success by 0.98%.
Overall, this confirms what I was thinking. Withdrawing small sums frequently is better than withdrawing large sums at once. The reasoning is simple: you keep money in the stock market for a longer time. So, you only keep enough cash to pay one month of expenses. The rest of the money keeps compounding.
What about the claim that you would help in bad times? On average, the stock market goes up more months than it goes down. This means you bet that the stock market will go down, although it should go up more regularly. It is better to bet that the stock market will go up rather than that it will go down. This is the same argument against Dollar Cost Averaging.
We will see if this holds true for longer retirement periods as well.
Retirement of 40 years
Here are the results with the same parameters but for a retirement that would last 40 years:
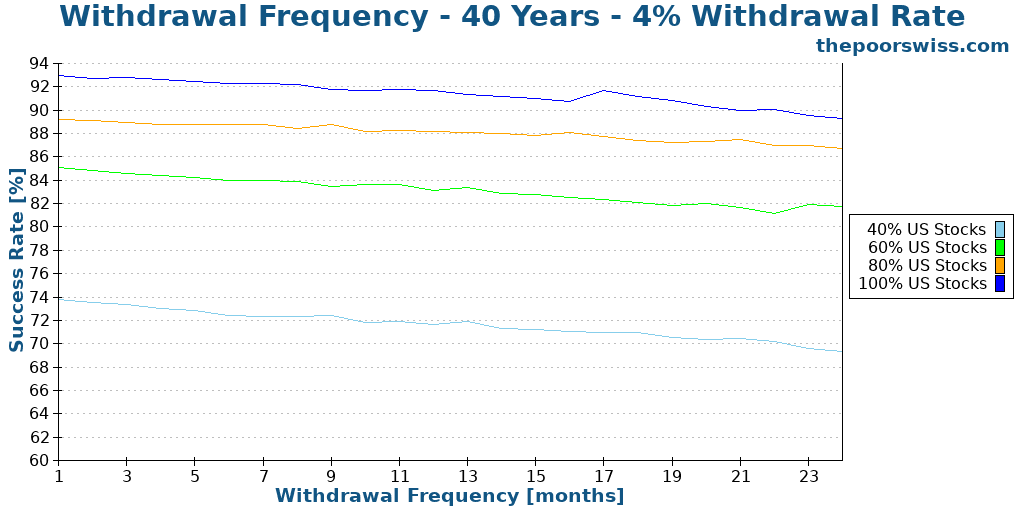
I have excluded all the portfolios that had less than a 75% chance of success, so we are left with three portfolios only.
We can see something quite interesting in these results. The differences between the different withdrawing frequencies are more significant than for 30 years.
On average, over 40 years, you would reduce your chances of success by 3.4% by withdrawing every two years instead of every month. If you withdraw every year, you would only reduce your chances of success by 1.54%.
So, not only is the withdrawal frequency significant, but it is also more significant as your retirement gets longer.
Retirement of 60 years
Here are the results with a final simulation with a retirement of 60 years:
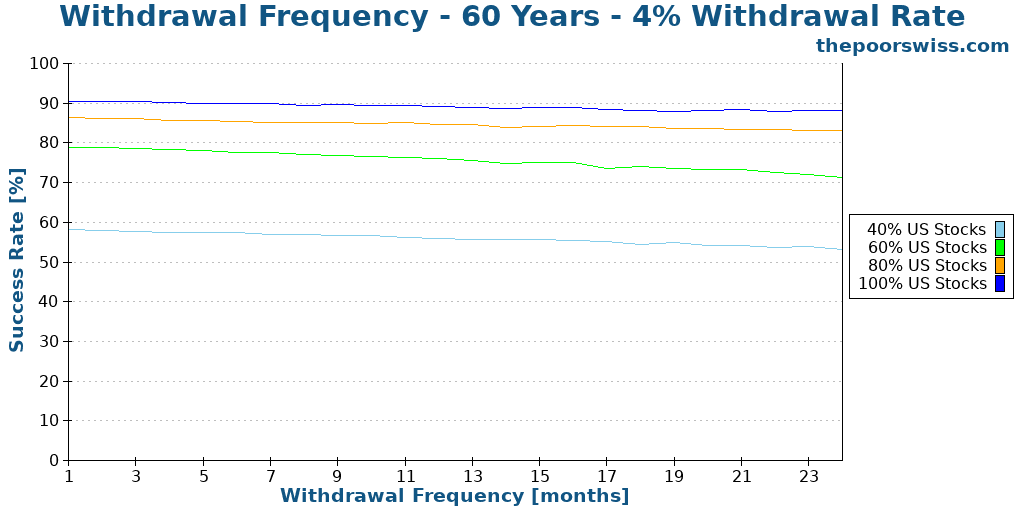
Interestingly, the difference is significantly higher for a higher percentage of bonds. This makes sense since you have lower returns. Hence, you need to capture them as much as possible. In this case, with a 60% stock portfolio, your chances of success would drop by 7.5% by withdrawing every two years! This is a very significant difference.
On average, over 60 years, you would reduce your chances of success by 3.72% by withdrawing every two years instead of every month. If you withdraw every year, you would only reduce your chances of success by 1.73%.
For a very long retirement, the withdrawing frequency gets more important. But for 60 years, it is not very significantly different than for 40 years. But we can see that some cases are very significant!
Other withdrawal rates
Until now, we did all our simulations with the famous 4% withdrawal rate. Does the same apply to other withdrawal rates?
Here are the success rates for various withdrawal rates and various frequencies with a 100% stocks portfolio:
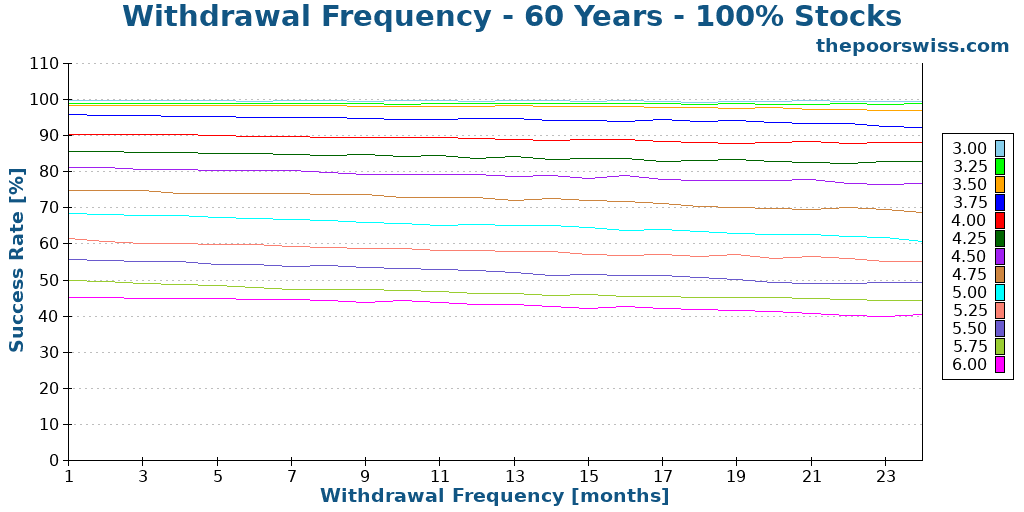
We can observe several things from these results. First, all withdrawal rates are impacted by the changes in withdrawing frequencies. Second, not all withdrawal rates are impacted equally.
Indeed, higher withdrawal rates are impacted more than lower withdrawal rates. This makes sense since lower withdrawal rates are less likely to fail, so there is no large area for improvement. On the other hand, an aggressive withdrawal rate is likely to fail, so it has a large capacity to improve.
For instance, when comparing 12 months and one-month frequencies, a 3.25% withdrawal rate would see its chances of success dropping by 0.3%, while a 6% withdrawal rate would lose a 2.6% chance.
Impact on the worst duration
We can also see if changing the withdrawal frequency would change the worst duration of a simulation. The worst duration is the lowest number of months, after which a simulation would fail. It is an interesting metric because occasionally the simulation’s worst duration can be catastrophic while having a high success rate.
So here are the worst durations for a 4% withdrawal rate and a 30-year duration:
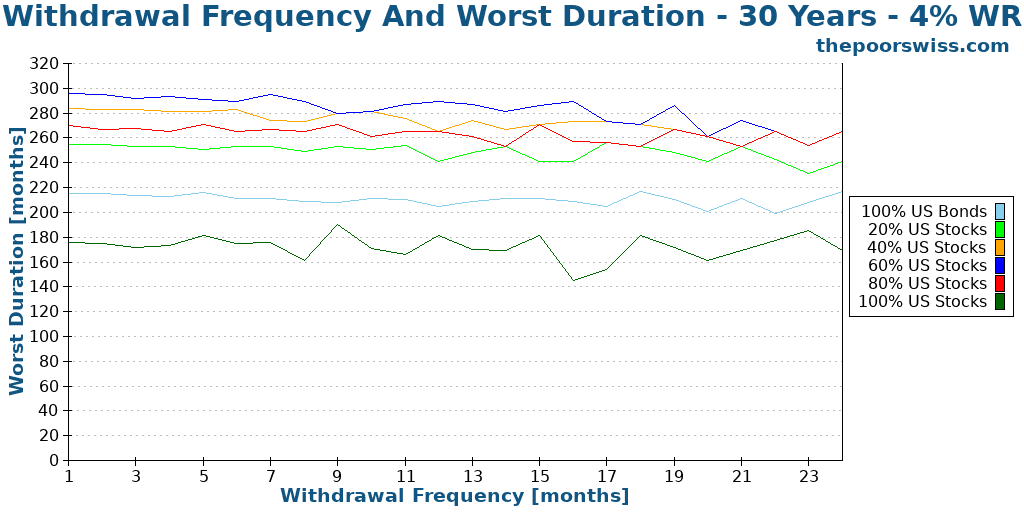
It is important to realize: while 100% is the best portfolio in terms of success rates, it is the worst in terms of worst durations. This is why it is important to look at the worst duration and success rate.
Now, we should go back to the withdrawing frequency. At first sight, it is not very clear what is going on here. For large allocations to stocks, the worst duration does not change much with the withdrawing frequency. It goes up and down. It is, in fact, logical since the success rate did not change much either.
Now, for more conservative portfolios, the impact of withdrawing less frequently is significant. We can see that the worst duration decreases as the number of months between withdrawals increases.
On average, withdrawing every year makes the worst duration worse by five months. And withdrawing every two years makes the worst duration worse by ten months.
So, not only do frequent withdrawals increase your chances of success, but it also reduces the worst duration of your portfolio in retirement!
Conclusion
We are now done with all the simulations! We can draw quite a few interesting conclusions:
- If you plan a retirement of at least 30 years, the frequency at which you withdraw money is important!
- Withdrawing money every month will increase your chances of a successful retirement.
- Withdrawing money every month improves the worst duration of your retirement.
- The withdrawing frequency is more and more significant as the duration of your retirement increases.
- The withdrawing frequency is less important for low withdrawal rates.
This confirms what I was thinking about withdrawing frequency. It is good to have strong data to make such decisions. If I ever retire from my portfolio, I will sell shares every month to live from them.
If you like this simulation, you can look at my previous article about investing frequency.
How often do you plan to withdraw while in retirement?
More reading

5 Great Ways to Reach Financial Independence
Financial Independence (FI) is a great state in which you do not depend on your income to live, so how can you reach FI? Here are a few ways!
Sequence of Returns Risk can ruin your retirement
Protect your retirement. Learn what Sequence of Returns Risk is and how a market crash early in retirement can destroy your portfolio.
Trinity Study with world stocks in 2026
Global FIRE? We test the Trinity Study (4% Rule) using World Stocks data instead of US stocks to see if safe withdrawal rates hold up globally.
Learn easy ways to optimize your finances and save thousands in Switzerland with our exclusive e-book. Learn about the most cost-effective financial services tailored for savvy residents and expats!
Get Your FREE Swiss Money-Saving Guide
Interesting post.
However, please note that in the UK there are some real-world implementation challenges, see e.g. comment (#24) at:
https://monevator.com/weekend-reading-diversified-reading/#more-55004
Hi Al Cam,
Wow, that’s interesting. (and sad for UK people). Here it would take less than a week to get the money out of the broker.
Thanks for sharing.
Hi ThePoorSwiss,
On a technical note, please can I ask whether the rebalance frequency was held constant during your tests (i.e. the rebalance frequency was independent of the withdraw frequency)? Obviously this has no effect on 100% stocks!
I ask because my own tests (much less thorough than yours) indicate the opposite result since withdrawing less frequently in 30-year retirements with a 60/40 portfolio starting in the 1960s made some slight improvements to the failure rate (3.5% with monthly withdrawals and 1.5% with annual withdrawals) with the rebalancing frequency kept constant. On a qualitative level, this makes some sense since there was a downward trend in real terms until the mid-1980s.
Hi Alan,
For these simulations, there was no rebalancing. This is what I recommend by default (a little more aggressive than most people would say). I have written an article about rebalancing frequency as well.
That’s interesting, what rebalancing frequency were you using in your tests?
Hi ThePoorSwiss,
Thanks for the info – I was using monthly rebalancing. More importantly, I note that I maintain two versions of my code (one simple, vectorised version and the other, loop driven and more complex but flexible) – I have just changed withdrawal frequency with the vectorised version and have ended up with the same result as you (i.e. that increasing the withdrawal interval tends to increases the failure rate). Now need to track down the discrepancy between the two versions! Thanks for the impetus…
Hi The Poor Swiss,
I eventually managed to track down and fix a rather subtle error in my code, and the results from both code versions now agree with yours… cheers for the article
Hi Alan,
I am glad you could fix your issue :)
Normally, the vectorized code has more issues than the standard one :P
Thanks for the link to another good read!
In your prior conclusions, you stated a preference for a 50/50 ratio. But I don’t see that as a great optimization. The 80/20 stock/bond looks to be a good allocation followed by 60/40. Both have good success rates and worst durations.
I think ERN’s glidepath would benefit from your take, but be careful. He has written a lot of articles since outlining the glidepath and they aren’t all clear to me. His most recent one is a good example as he is trying to optimize, but losing the story.
Thanks again!
Hi Justin,
Where I did talk about a 50/50 bond/stock allocation? I never wanted so much bonds.
Yes, not all of his posts are easy to follow.
Very good article! It answers some very relevant questions. I have a few follow on that may give you ideas for future analysis.
1. If you follow Early Retirement Now, Carsten has been developing a glidepath (start retirement with more bonds and gradually shift back to 90 or 100% stocks over a 5-10 year window). It seems to improve success rates, but I think you can add a more accessible analysis.
2. If you own more bonds, you can take advantage of market fluctuations when you draw down. Say stocks are up, withdraw stocks. Stocks are down, withdraw bonds. Obviously oversimplified. Most will accuse me of market timing, but this isn’t really a timing strategy, more like knowing the situation and selecting the optimal path given that knowledge.
3. I didn’t see if you made any recommendations about stock/bond allocations. It looks like 100% stock has the highest success rate, but when it fails, it fails hard and fast. Do you prefer 80/20 or 60/40 splits?
Hi Justin,
Thanks for your kind words :)
1) Yes, I have read several of his articles. My data is actually based on the same data. I did not read the one on glide path, I will take a look.
2) It’s true that there are ways to be “smarter” about selling bonds and stocks. But this also depends on your rebalancing strategy. I could try to cover this in another article :)
3) I am not entirely on my own asset allocation in retirement. Currently, I go with 100% stocks since I believe this is the most efficient while in the accumulation phase. If you look into my other Trinity Study article, you will see that I also consider the worst duration as a metric next to the success rate. This shows the value of bonds. Currently, given the bad shape of bonds in Europe, I would not go with more than 20% bonds while in retirement, but this may change.
I liked your article and simulations. But I am not sure that data from pre-1929 is really relevant. The stock market before then was very different. How dud you account for CPI data back that far?
Hi Dividend,
Official CPI was calculated from the first world war. Before that, it was estimated by splicing together several datasets. For instance, you can see a method here: https://www.minneapolisfed.org/about-us/monetary-policy/inflation-calculator/consumer-price-index-1800-
It’s true that this period may not be relevant. But we may see similar periods in the future.
I have written an article when I only take recent data into consideration: Does the 4 percent rule work in recent years?
Hi Mr Poor Swiss,
Sorry for the over simplifying question that might not be in line with the trinity theory but wouldn’t it make sense to move from an accumulation portfolio to a dividend portfolio once reached the Fire number and so preserving the capital?
Hi Mattia,
If you are limiting yourself to living on the dividends, you are likely to need more money than relying on withdrawals.
In Switzerland, dividends also have higher taxes than capital gains.
So, I do not think it would make more sense, no. But this is a strategy that some people are following.
Thank you for your answer.
I actually thought about this before deciding whether to go for accumulating or distributing ETFs. I decided on distribution because it will pay me without me needing to sell. The reason I wouldn’t shift is because by selling the ACC & buying the DIS, I would be realizing all the capital gains on the ACC and thus be tax liable, right? That was my thinking anyway, and my reason for buying DIS right away.
We have auto-withdrawal once a month to our checking account. This simulates a paycheck. We’ve just started doing this and we will be able to track our spending by watching the balance in checking. There are a couple of small pension deposits that also go into the account monthly. I don’t think we will really be spending this much but started on the high side and can trim it over time if needed. This all comes out of the bond portion of our portfolio but since it rebalances periodically it will actually be coming from whichever investments have made the most money.
Hi Steve,
Thanks for sharing your strategy!
It makes sense to start higher. When you realize you have too much cash, you can stop the withdrawals for some time.
Good luck with your retirement!
Really insightful! I would have intuitively gone with a less frequent withdrawal rate (fear for market correction), but the data clearly suggests the opposite!! Thanks
I am glad it’s helpful :)
To avoid some market correction madness, some people prepare an extra one year (or more) buffer of expenses that they use if the effective withdrawal rate gets too high. It can help a little, but means you need to accumulate more cash.
Thanks for running those simulations for us, now we have more information to take the right decision.
Great job, as usual.
You are welcome :)
Hi ThePoorSwiss. If you are considering withdrawing money by selling stock upon retirement, does an accumulating ETF portfolio make sense? You will clearly not live only from dividends, in which case, having a strong accumulating focused portfolio (ACC ETFs, with no hassle on paying fees on those reinvested dividends) might make more sense?
Hi Dan,
In retirement, it should make no difference whatsoever. Since I use U.S. ETFs, there are only distributed ETFs available. In retirement, it is actually cheaper to use a distributing ETF since you will have to sell fewer shares since some of the money will come from dividends.
But if you can find a good accumulating ETF, you will be fine as well.