
Backtesting vs Bootstrapping for FIRE in 2026
| Updated: |
(Disclosure: Some of the links below may be affiliate links)
On this blog, I have shared many analyses of FIRE strategies using historical data. With historical data, we can validate that a strategy would have worked in the past. This method is called backtesting.
But there is another way to use historical data: bootstrapping. Instead of using the exact past, we use historical data to craft many examples of the past. But what does that mean for FIRE? In this article, we compare these two methods and apply them to FIRE.
Historical analysis – Backtesting
Historical analysis is rather simple. We use historical data to test a strategy. For instance, for financial independence, I often use this to compare different withdrawal rates or withdrawal strategies. We can even use that to compare rebalancing.
This requires having historical data. For Financial Independence and Retire Early (FIRE) simulations, we generally use the US stock market historical data. This data is available from 1871 to today. This means we have a nice amount of data at our disposal. And since the data is available for each month, we can do many monthly simulations.
The purest form of historical analysis is called backtesting (also called historical simulation). It simply means replaying a strategy in the past as it was. If we do a 50-year retirement test, we will test a period from January 1871 to January 1921 and the period from February 1871 to February 1921, and so on.
This is the strategy I have been using on this blog for a long time, and it works well when you have data available.
However, backtesting has two disadvantages:
- It cannot deviate from the past and test other things that could have happened. Since the future is uncertain, it means that we have little idea of how our strategy would work in a future that is different from the past.
- The second issue is that it can test only periods that are available. This can be an issue if there are few periods available. For instance, if you have 60 years of data, you can only test 120 monthly periods of 50 years of retirement. And if you only have 50 years, you can only test one.
Another strategy, bootstrapping, can help with these cases.
Bootstrapping
Bootstrapping (or sampling) also relies on historical data. But where backtesting was testing one past, bootstrapping is creating multiple pasts. To achieve that, we create many periods using sampling with replacement. It sounds complicated, but it is actually not at all. In a given period, instead of following the years in order, we shuffle them. For instance, if you have a dataset from 1900 to 1910, bootstrapping 5 years could create such periods:
- 1901, 1903, 1900, 1909, 1905
- 1905, 1908, 1902, 1902, 1910
- 1908, 1901, 1900, 1904, 1907
- 1909, 1909, 1901, 1907, 1904
So, for each year of the period, we draw a year from the set, allowing a year to be present multiple times.
The main advantage is that we can create many more test periods than with backtesting. If we have 50 years of data, we can easily create millions of different test periods. And it can explore pasts that have never happened before.
Of course, the main disadvantage is that it will create pasts that are extremely unlikely. For instance, it could create two Great Depressions in a row (or even more than two). It could also create multiple dot-com bubbles without the crash in a row.
There are also some advanced bootstrapping techniques, like block bootstrapping. But we will not delve into them in this article.
So, now that we have explained these two methods, we can run some simulations to compare them.
Simulations
I have done many simulations on this blog. Over time, I have developed a complete tool to do historical simulations for FIRE. For instance, I used this tool to update and improve the results of the Trinity Study. Everything is available online.
In all my simulations, I am using monthly returns. I will be using data for the US stock market from 1871 to 2025. I will also be using US inflation data for the same period. In all cases, I will test all potential starting months.
If you want to apply these to another country, like Switzerland, you would need to use the USD/CHF exchange rate on top of the stock market returns. And you would need Swiss inflation as well. I intend to do that in a future article since USD/CHF historical data exhibits issues with backtesting.
In these simulations, I will not do yearly rebalancing and will assume fees of 0.10%.
For bootstrapping, I will run 10,000 simulations for each of the tests. Even though I am using monthly returns, the bootstrapping is done per year. This avoids using entirely random data and keeps some logic in the sequences of returns.
It is important to note that bootstrapping is random. This means if I run my simulations multiple times, I get multiple results. However, by using 10,000 simulations, the results are relatively stable. Running 10,000 simulations is generally standard for statistical stability.
Success rate
To compare these two methods and draw some conclusions, we will start with the success rate of different withdrawal rates and portfolios.
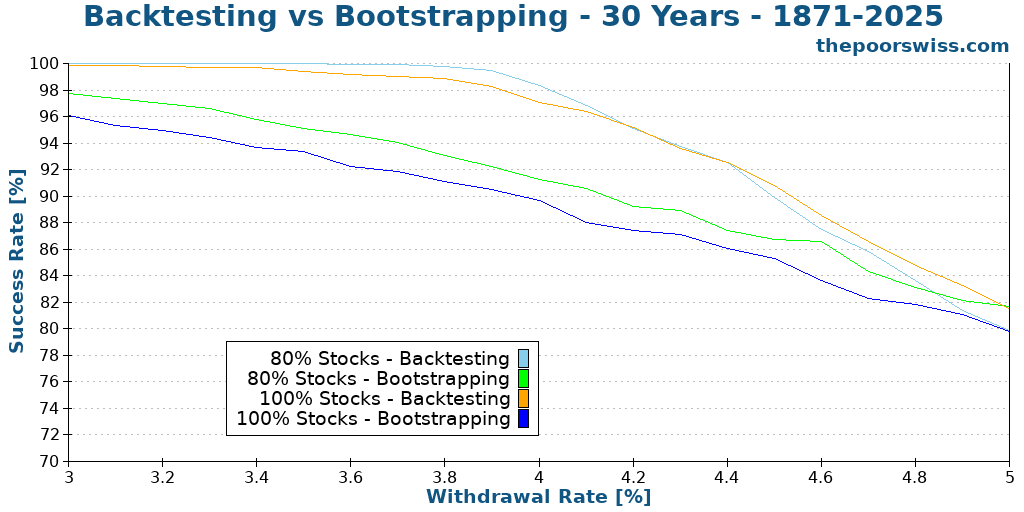
Even in this first scenario, there are already more differences than I expected. The first thing that surprised me is that bootstrapping always yields lower success rates. For instance, at the famous 4% withdrawal rate:
- Backtesting yields about 97% with 100% stocks and 99% with 80% stocks
- Bootstrapping yields about 90% with 100% stocks and 91.5% with 80% stocks
This is a very significant difference. For many people, a 7% lower chance of success might mean a change of strategy. So, what simulation method is wrong? Neither. Both simulation methods serve different purposes. The main difference is that bootstrapping will ignore market cycles (correlation between years).
It could create sequences where we have multiple crashes in a row or many excellent years in a row. In practice, this usually does not happen because we have had market cycles for a long time. Such sequences of returns risk highly penalizing our success rates.
But bootstrapping also has an advantage. We know what the past is made of, but we do not know about the future. We expect there will be market cycles, and we expect it to be reasonably like the past, but it will not match the past exactly. Bootstrapping offers an alternative way of testing a strategy.
Sometimes backtesting is too optimistic and bootstrapping is too pessimistic, so it is good to use both to get an idea of the middle ground.
We can continue and switch to 40 years of retirement.
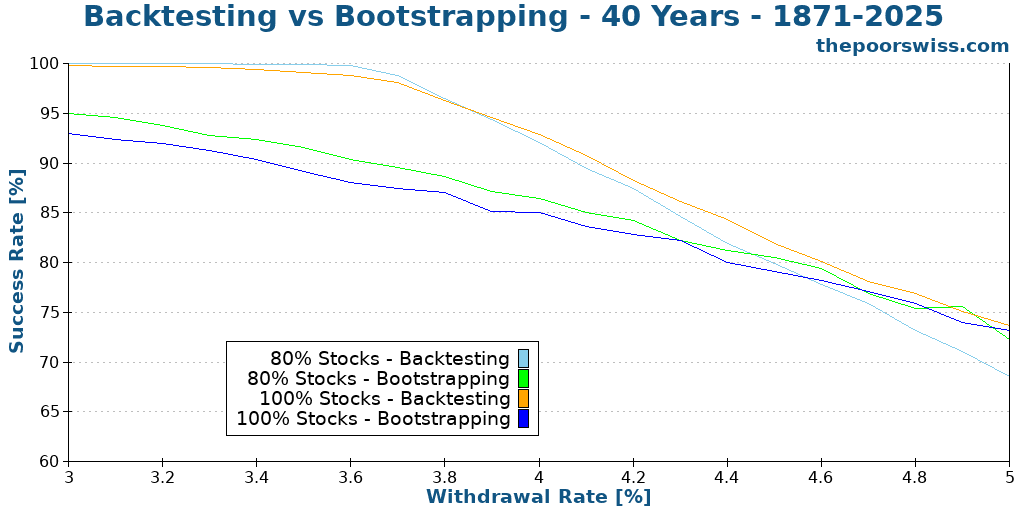
Our main observation is that bootstrapping yields worse success rates than backtesting. However, we can now observe that for higher withdrawal rates, the trend can reverse. The magnitude of the difference between backtesting and bootstrapping gets lower as the withdrawal rate increases.
We can check if this stays true with 50 years of retirement.
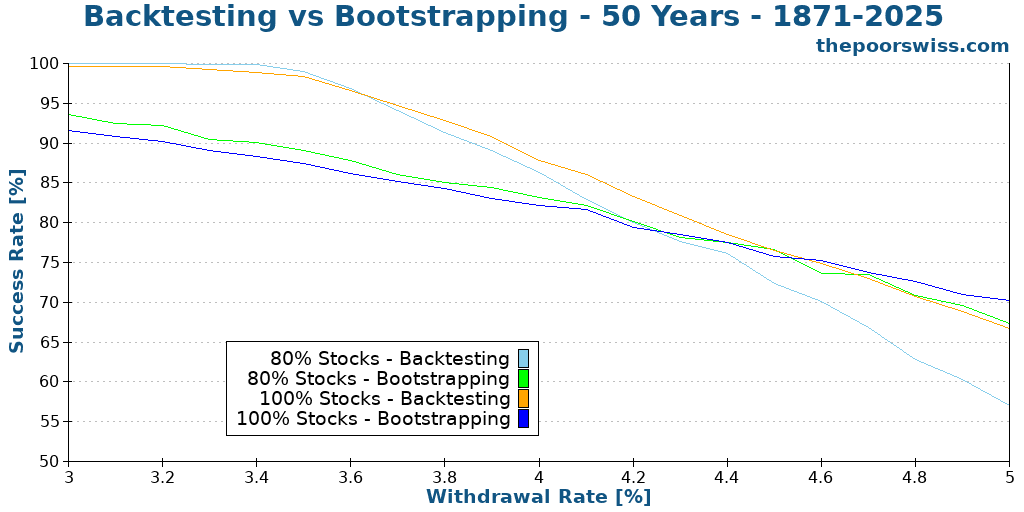
The same trend continues. We can already see bootstrapping results getting better at around a 4.2% withdrawal rate.
Overall, I think the results are fascinating. I was not expecting that much of a difference between backtesting and bootstrapping. These results show the limits of both methods.
Terminal values
We should also see the impact on terminal values.
For that, we can look at the average terminal values after 40 years with 100% stocks.
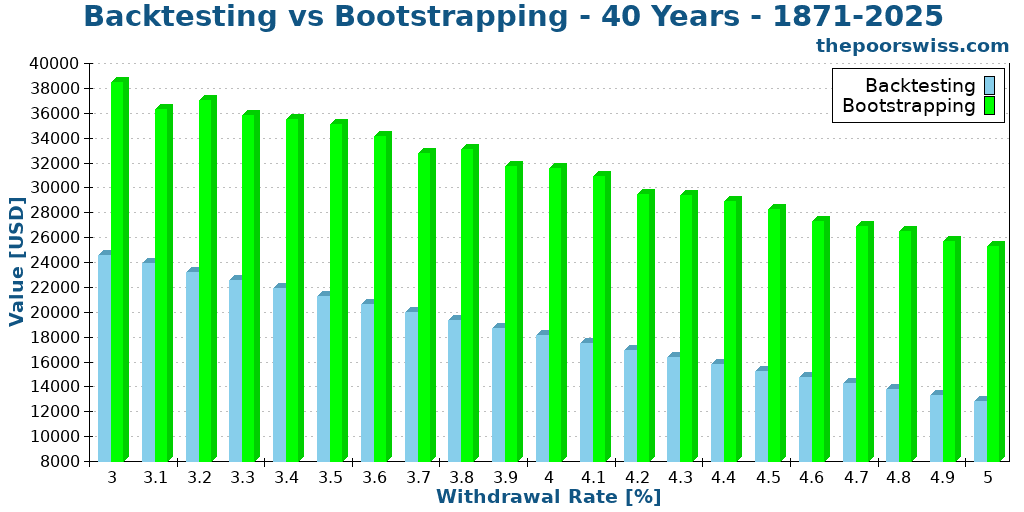
The difference between the two methods is quite significant. We can see that bootstrapping always has a higher average terminal value. This may sound counterintuitive given that the average success rate is lower with bootstrapping. But since we draw years randomly, we can end up with sequences of exceptional returns that will skew the average. Generally, average terminal values are skewed to high values when doing such simulations.
Another thing we notice is that the progression is linear for backtesting but not for bootstrapping. How can a higher withdrawal rate yield higher performance? The reason is simple: bootstrapping relies on random sampling. This means that each simulation can be different, and when we look at an average terminal value, there can be significant variation between runs.
For completeness, we can do the same simulation for 50 years:
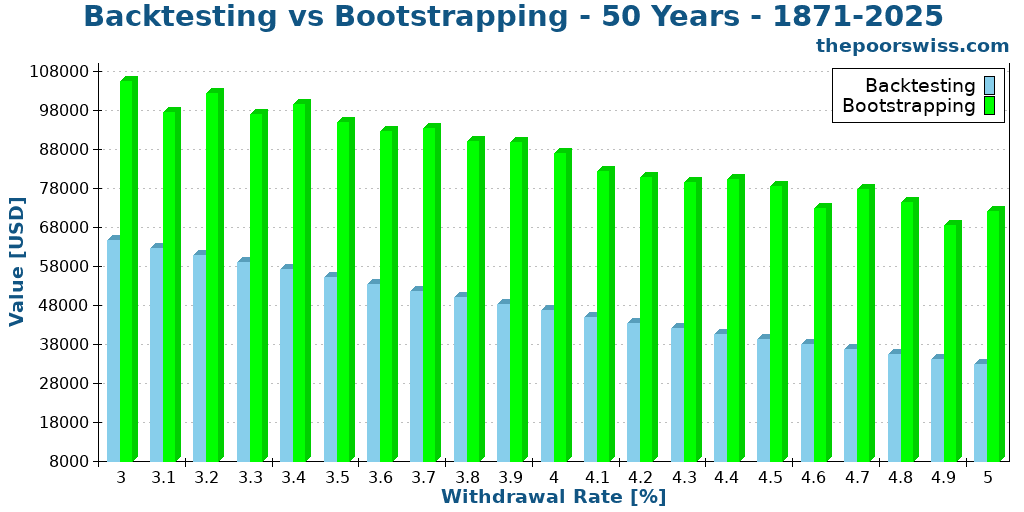
The observations are the same for 50 years as they were for 40 years. All terminal values are higher, as expected, because of using an average.
Worst duration
The last metric I like to look at is the worst duration of a simulation. This means how early it could have failed in the worst case. Does bootstrapping produce different results than backtesting?
We can directly check the results for 50 years of simulations.
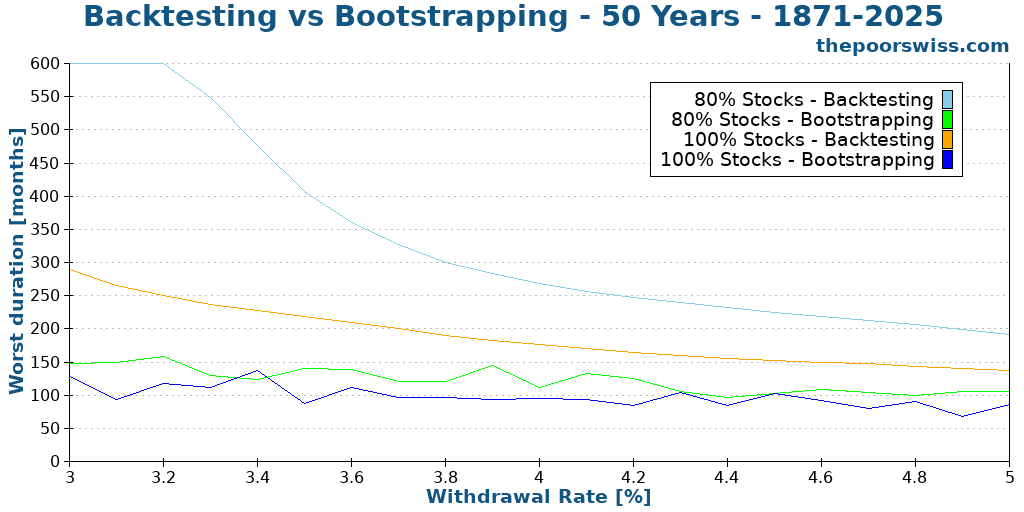
Again, while the backtesting curves are linear, the bootstrapping curves are very unstable. This is due to the random nature of bootstrapping. And we can quickly see from this graph that finding the worst duration does not really make sense for bootstrapping. Since we are getting a single value out of 10,000 simulations, we simply end up with the worst random selection of years from the past.
Overall, we should probably forget the worst duration metric when we look at the bootstrapping simulation.
Short periods
One big advantage of bootstrapping is being able to handle short historical timeframes. I have already tried to do that with FIRE simulations with modern history. But this is not great with backtesting since we are limited by the data set.
Since we have about 150 years of data, I thought it would be interesting to compare them for 50-year retirement periods. So, we will cut our dataset into three parts:
- 1875 to 1925
- 1925 to 1975
- 1975 to 2025
And we will do bootstrapping on each of these three periods for 50 years of retirement. The goal is to see how different periods in time would have worked for FIRE.
So, here are the results.
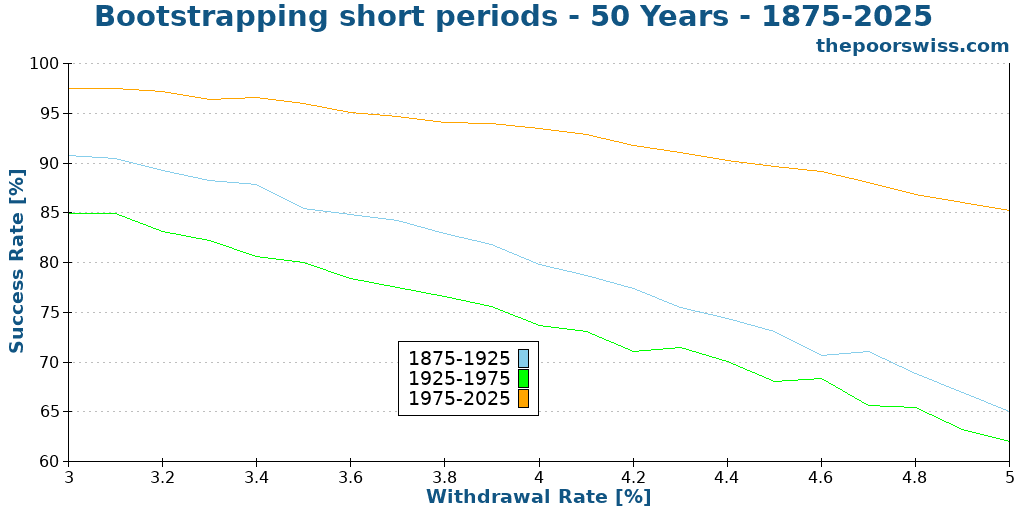
And the results are definitely interesting! Each period is very different from the others. I actually did not expect such a difference. We can draw some observations:
- The worst period to retire was the period from 1925 to 1975. This makes sense since it contained the Great Depression, the worst financial crisis of modern times. Even a 3% withdrawal rate would not have performed really well.
- The best period to retire is the last 50 years, from 1975 to 2025.
- The earliest period, from 1875 to 1925, sits somewhere in the middle.
The good news is that the past 50 years have been the best times to retire early. If this trend continues, we have a good chance of retirement. However, there have been periods in the past where it was much more difficult to retire, so we should not forget that.
Running your own simulations
If these simulations made you want to run your own bootstrapping simulations, I have a calculator for you. Our advanced FIRE calculator now has a new feature to switch from backtesting to bootstrapping (in the form, change the simulation method).
For now, I have limited these simulations to 2,500 runs to avoid any issues on the servers. I will monitor this and see if I can increase it. You may not see much randomness between runs since requests are cached for performance.
You can also use it directly below by changing the simulation method and comparing the results.
Calculator
Conclusion
Overall, bootstrapping offers an interesting alternative simulation method to backtesting. Both simulation methods have pros and cons, and both can be an interesting tool to test our FIRE strategies.
That being said, we have to be careful when we look at the results of bootstrapping. One important thing in stock market history is that there have always been cycles. It means that there is a serial correlation between years that is entirely forgotten when doing bootstrapping. This is one of the reasons results are generally worse with bootstrapping than with backtesting.
For me, the main advantage of bootstrapping is being able to work with short periods of data. For instance, simulating retirement for 50 years with the last 50 years of data. It is simply not possible with backtesting.
There is another interesting simulation method that many people use for FIRE planning: Monte Carlo simulations. Instead of focusing on the past, this method tries to simulate the future. I want to cover it in the next installment of this series. Then, I would like to consolidate my Swiss FIRE analysis with these methods.
So far, I do not plan any change to my strategy. But these worse results with bootstrapping reassure me in using my lower-than-average withdrawal rate of 3.8%.
If you are interested in other advanced simulations, you might want to read about equity glidepaths for FIRE.
What about you? Which simulation method do you prefer?
More reading

9 Things that are Wrong With FIRE
Is FIRE perfect? We discuss the common criticisms and downsides of the Financial Independence, Retire Early movement.
Add some margin of safety to your FIRE plan
A good FIRE plan relies on historical data, so we need to protect it with some margin of safety! Here are some ways to achieve extra safety!
All you need to know about the Trinity Study
The 4% Rule explained. Learn about the famous Trinity Study, how it determined safe withdrawal rates, and what it means for early retirement.
Learn easy ways to optimize your finances and save thousands in Switzerland with our exclusive e-book. Learn about the most cost-effective financial services tailored for savvy residents and expats!
Get Your FREE Swiss Money-Saving Guide
Bootstrapping can also be used to pull randomly bigger blocks of say 2 years, to preserve SORR. Or even better, you can use a technique with variable block size, where blocks can vary for example from 6 months to 6 years. See the stationary bootstrap method of Politis & Romano. You get more variation then historical backtesting, but preserve the typical cycles that are present in the market. I believe that is the way to go.
Hi Sam,
You can indeed increase the size of the blocks, a technique called “block bootstrapping.” I thought about doing it, but I wanted to keep the article simple. Otherwise, I would have to go over multiple block size.
Interesting point about variable block size. I was not aware of that. I will look into it! Thanks!
Take a look at https://metricgate.com/docs/stationary-bootstrap-politis-romano/
You have to specify the average block length. This method will distribute around that.
Which mean is suitable depends amongst other things on your dataset and the retirement period you are simulating. There are various academic papers out there that experiment with this. I believe with your dataset and retirments periods you might want to settle with 10 year average, which will capture long bull and bear markets. But good to experiment a bit.
Thanks, I will take a look and think about doing a future article about that.
Hi, thank you for this good work. What forward returns data are you using in your Monte Carlo simulations?
Hi Andrew
In this article, I am not doing Monte Carlo, both backtesting and bootstrapping are using historical data. The historical data for stocks are from S&P500 and the bonds are from 10Y treasury bonds.
I should have some Monte Carlo results soon on this blog. In this case, I am using the same data to extract historical returns averages and then use that to derive forward returns.